
Context: Defense + aerospace innovation programs focused on next-generation data visualization, mission-critical tools, and experimental prototypes
Role: Sr. Lead Product Designer · Ideation & Discovery
Timeline: Dec 2017 – Feb 2019
Zoic Labs
Transforming Defense Data Into Actionable, High-Velocity Tools
Designed a suite of mission-critical interfaces for aerospace, defense, and intelligence teams—spanning classification-safe screen sharing, real-time data visualizations, sentiment-driven BTC simulations, and early orbital debris tracking tools. My work established systems, workflows, and visualization patterns that helped teams analyze high-volume data with greater clarity, speed, and operational confidence.
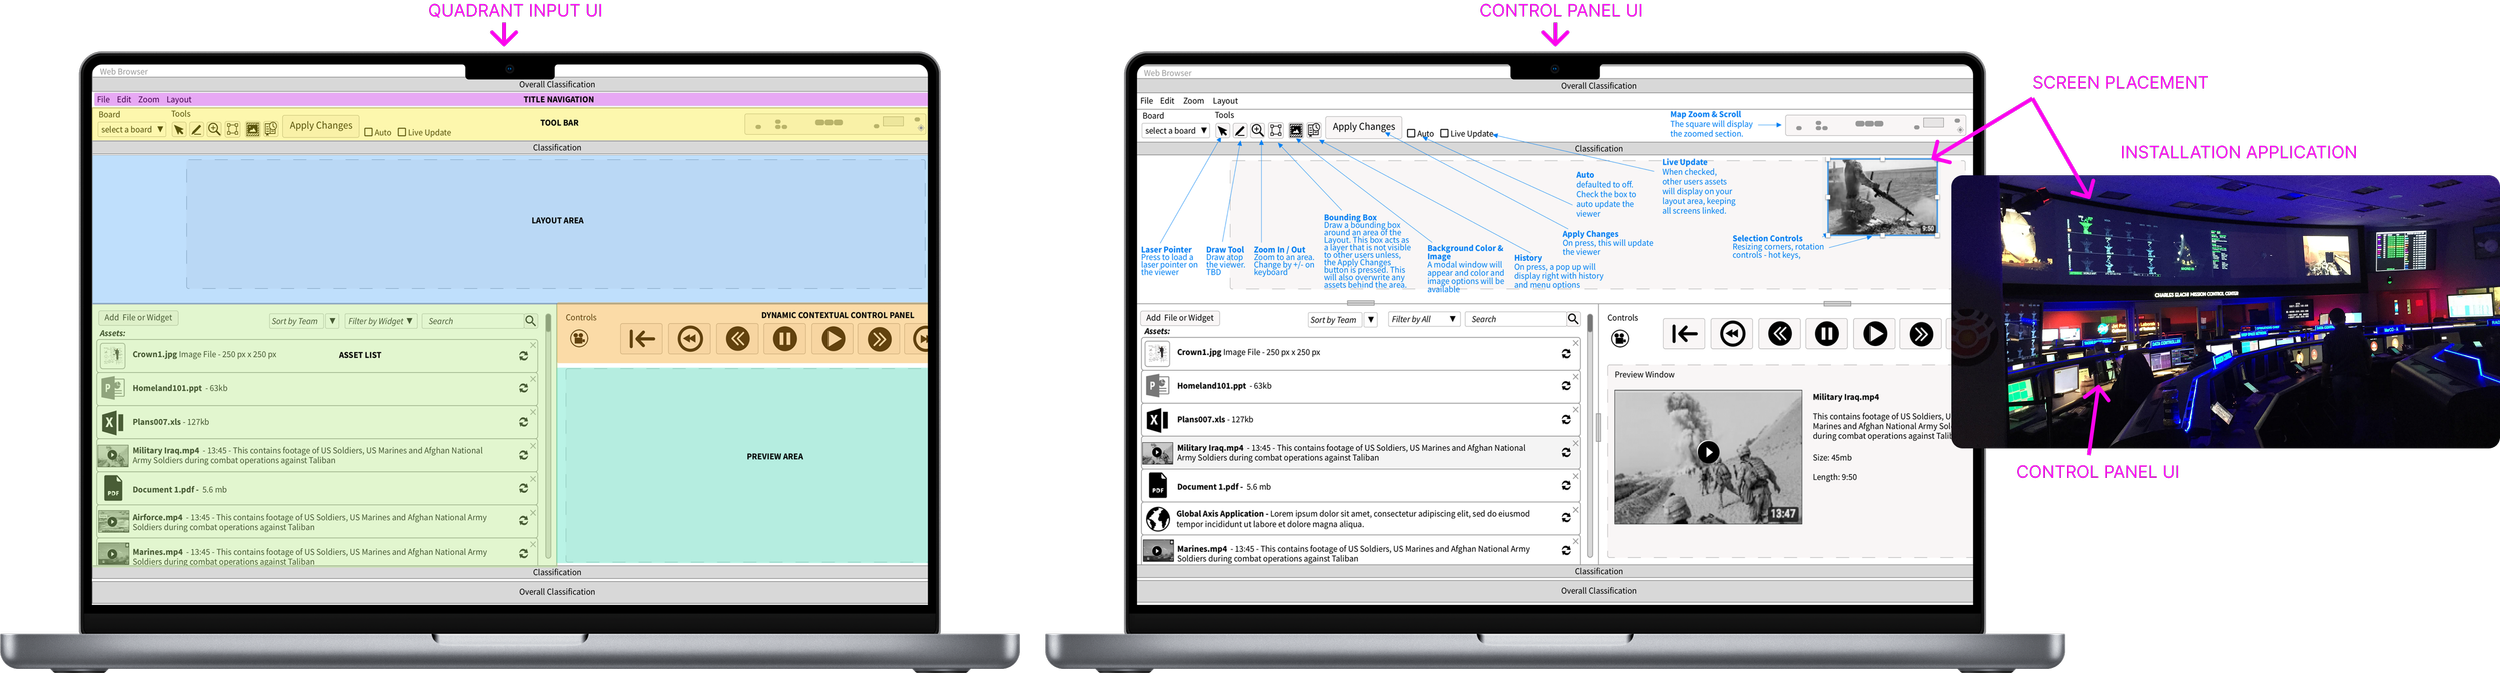
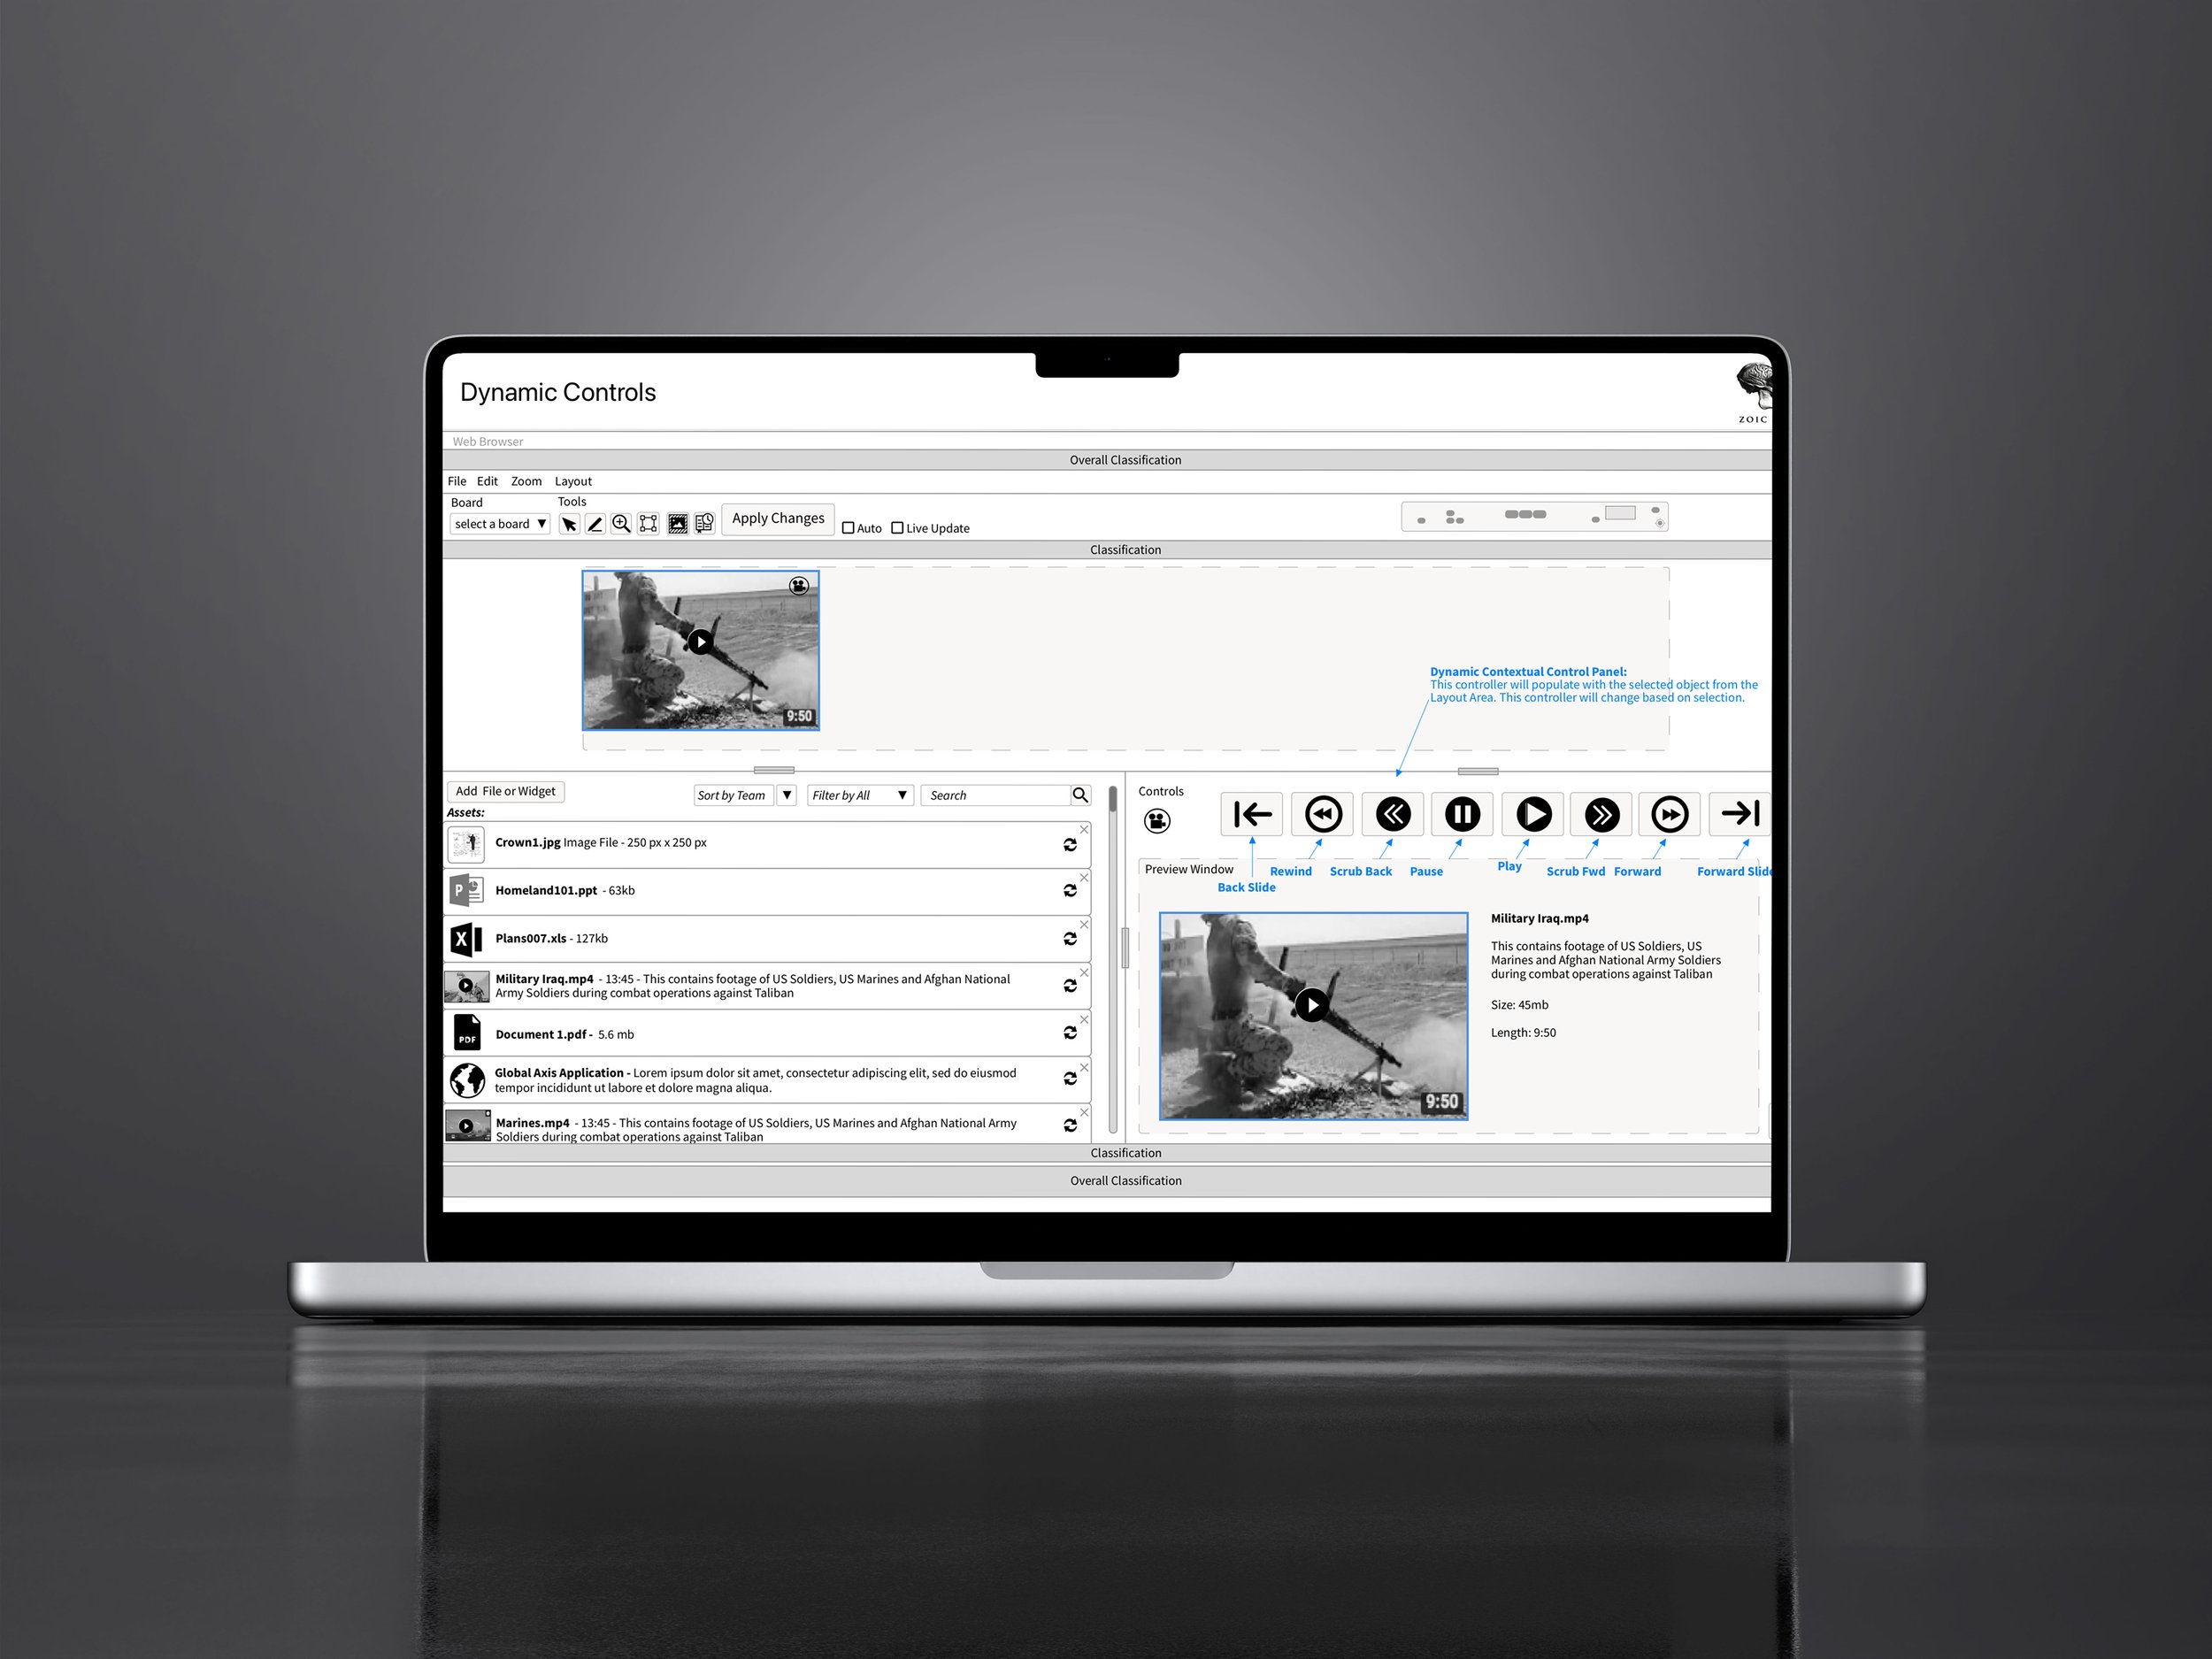
Classification Screen Sharing SaaS Tool
This video shows the operational UI in action. The tool was built to securely display and share mission-critical assets—live video feeds, satellite imagery, diagnostic tools, and geospatial visuals—in a single interface.
I designed the interaction model and core layouts to support real-time analysis while enforcing strict classification rules. Access to each visual layer could be controlled based on permissions, ensuring sensitive intelligence was only visible to authorized users..
01
Understanding Multi-domain Workflows
Discovery & program alignment
Fragmented Analyst Tools — Intelligence teams were switching between unrelated systems to compare satellite data, diagnostics, and live feeds.
Cross-Product Dependencies — All three tools shared overlapping needs in visualization, security, and multi-source data composition.
Classification Constraints — Each UI model required strict permission-based visibility to align with defense-level access control.
Need for a Unified Framework — Early discovery showed the opportunity for shared components and interaction logic across all projects.
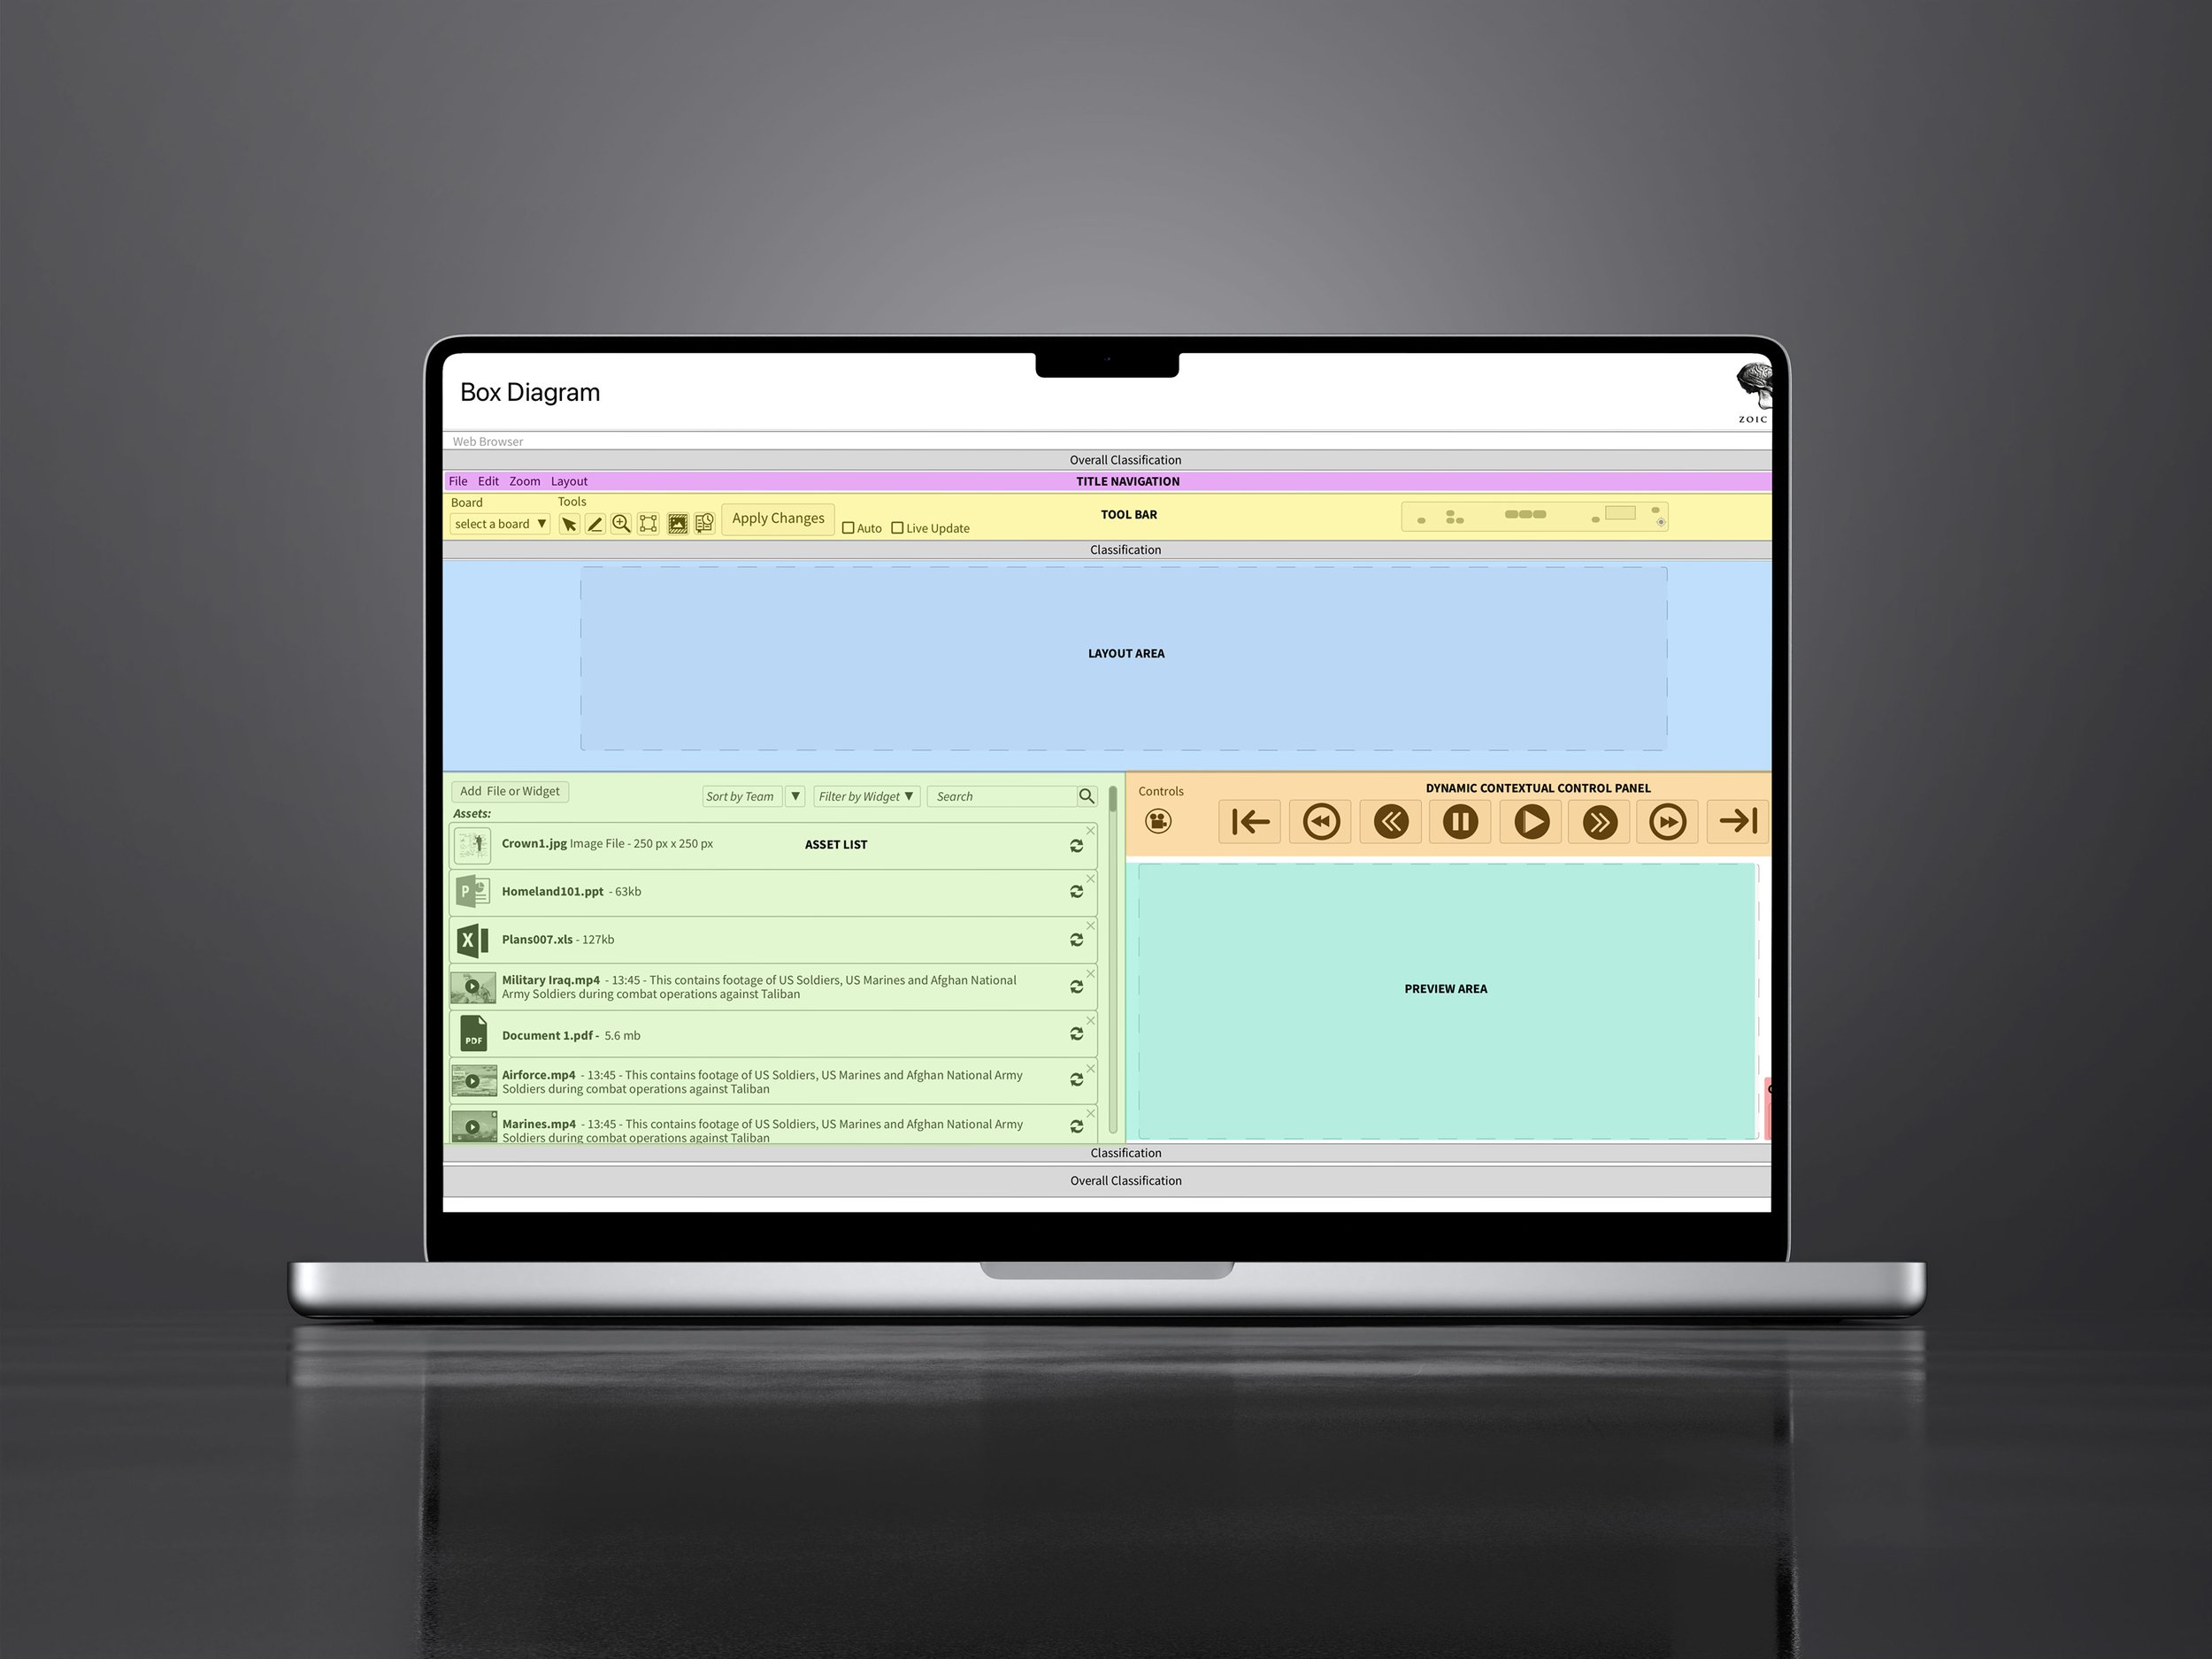
Box Diagram - sections of UI
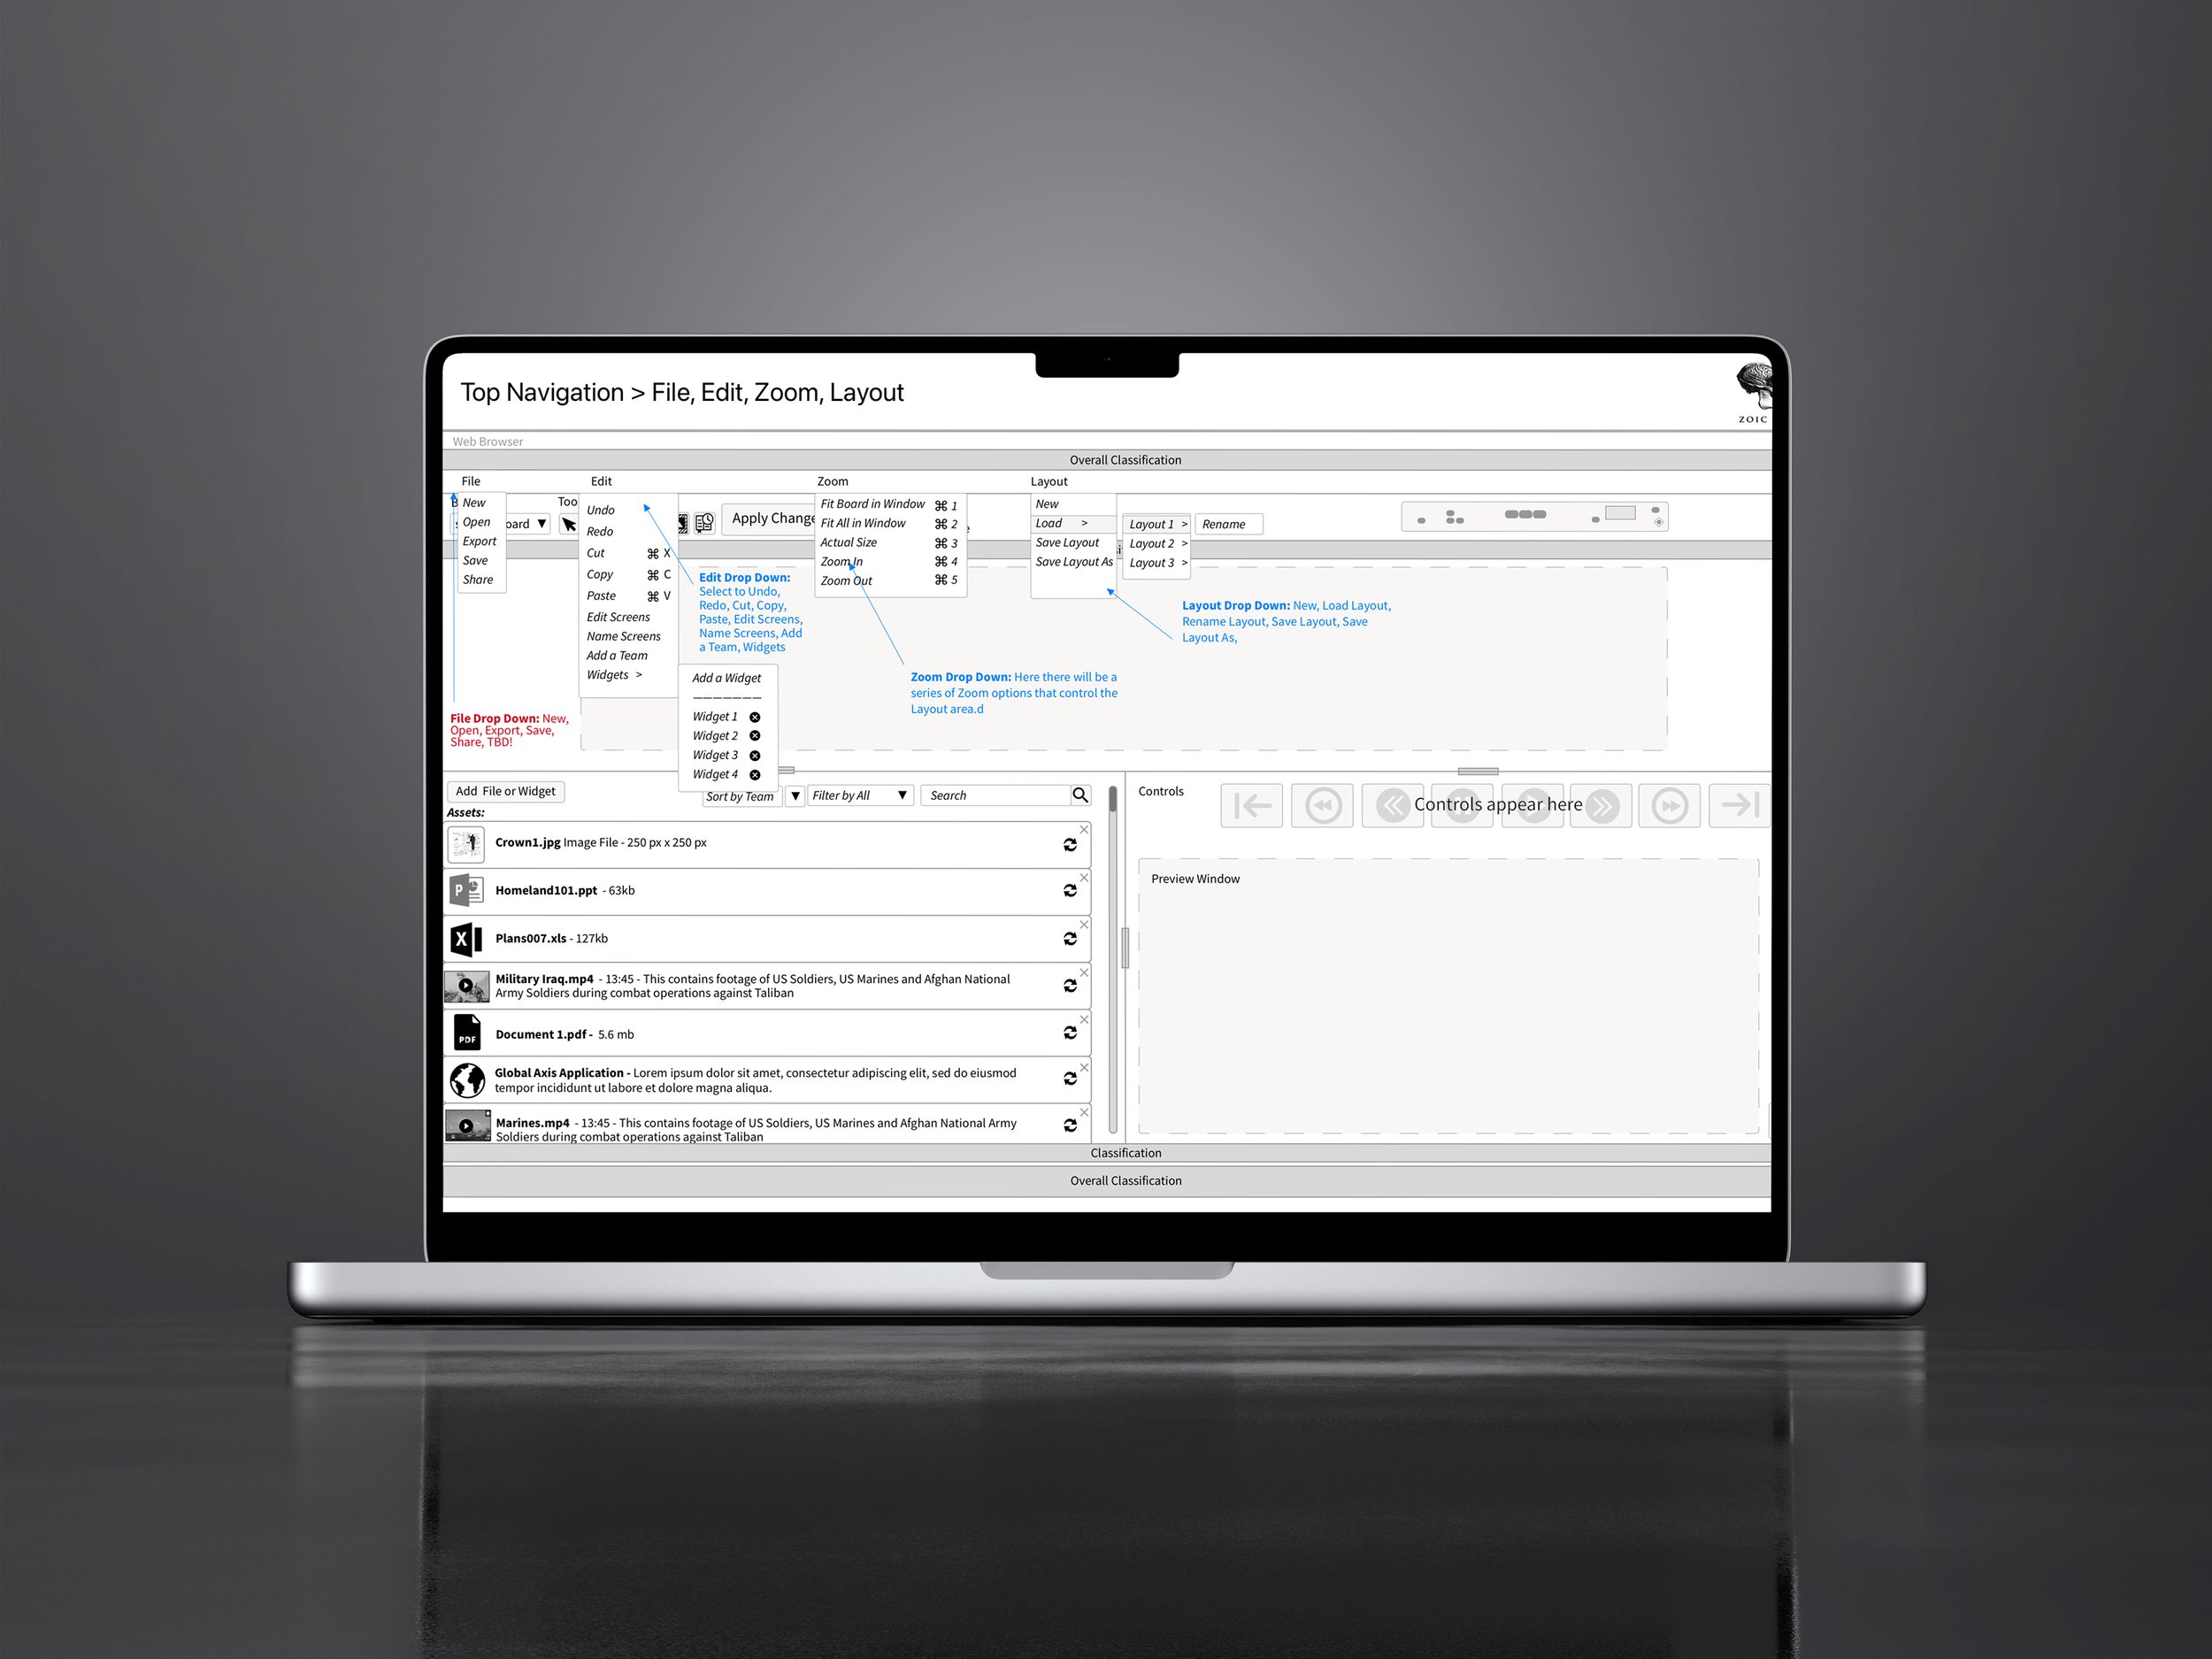
Navigation: File, Edit, Layout
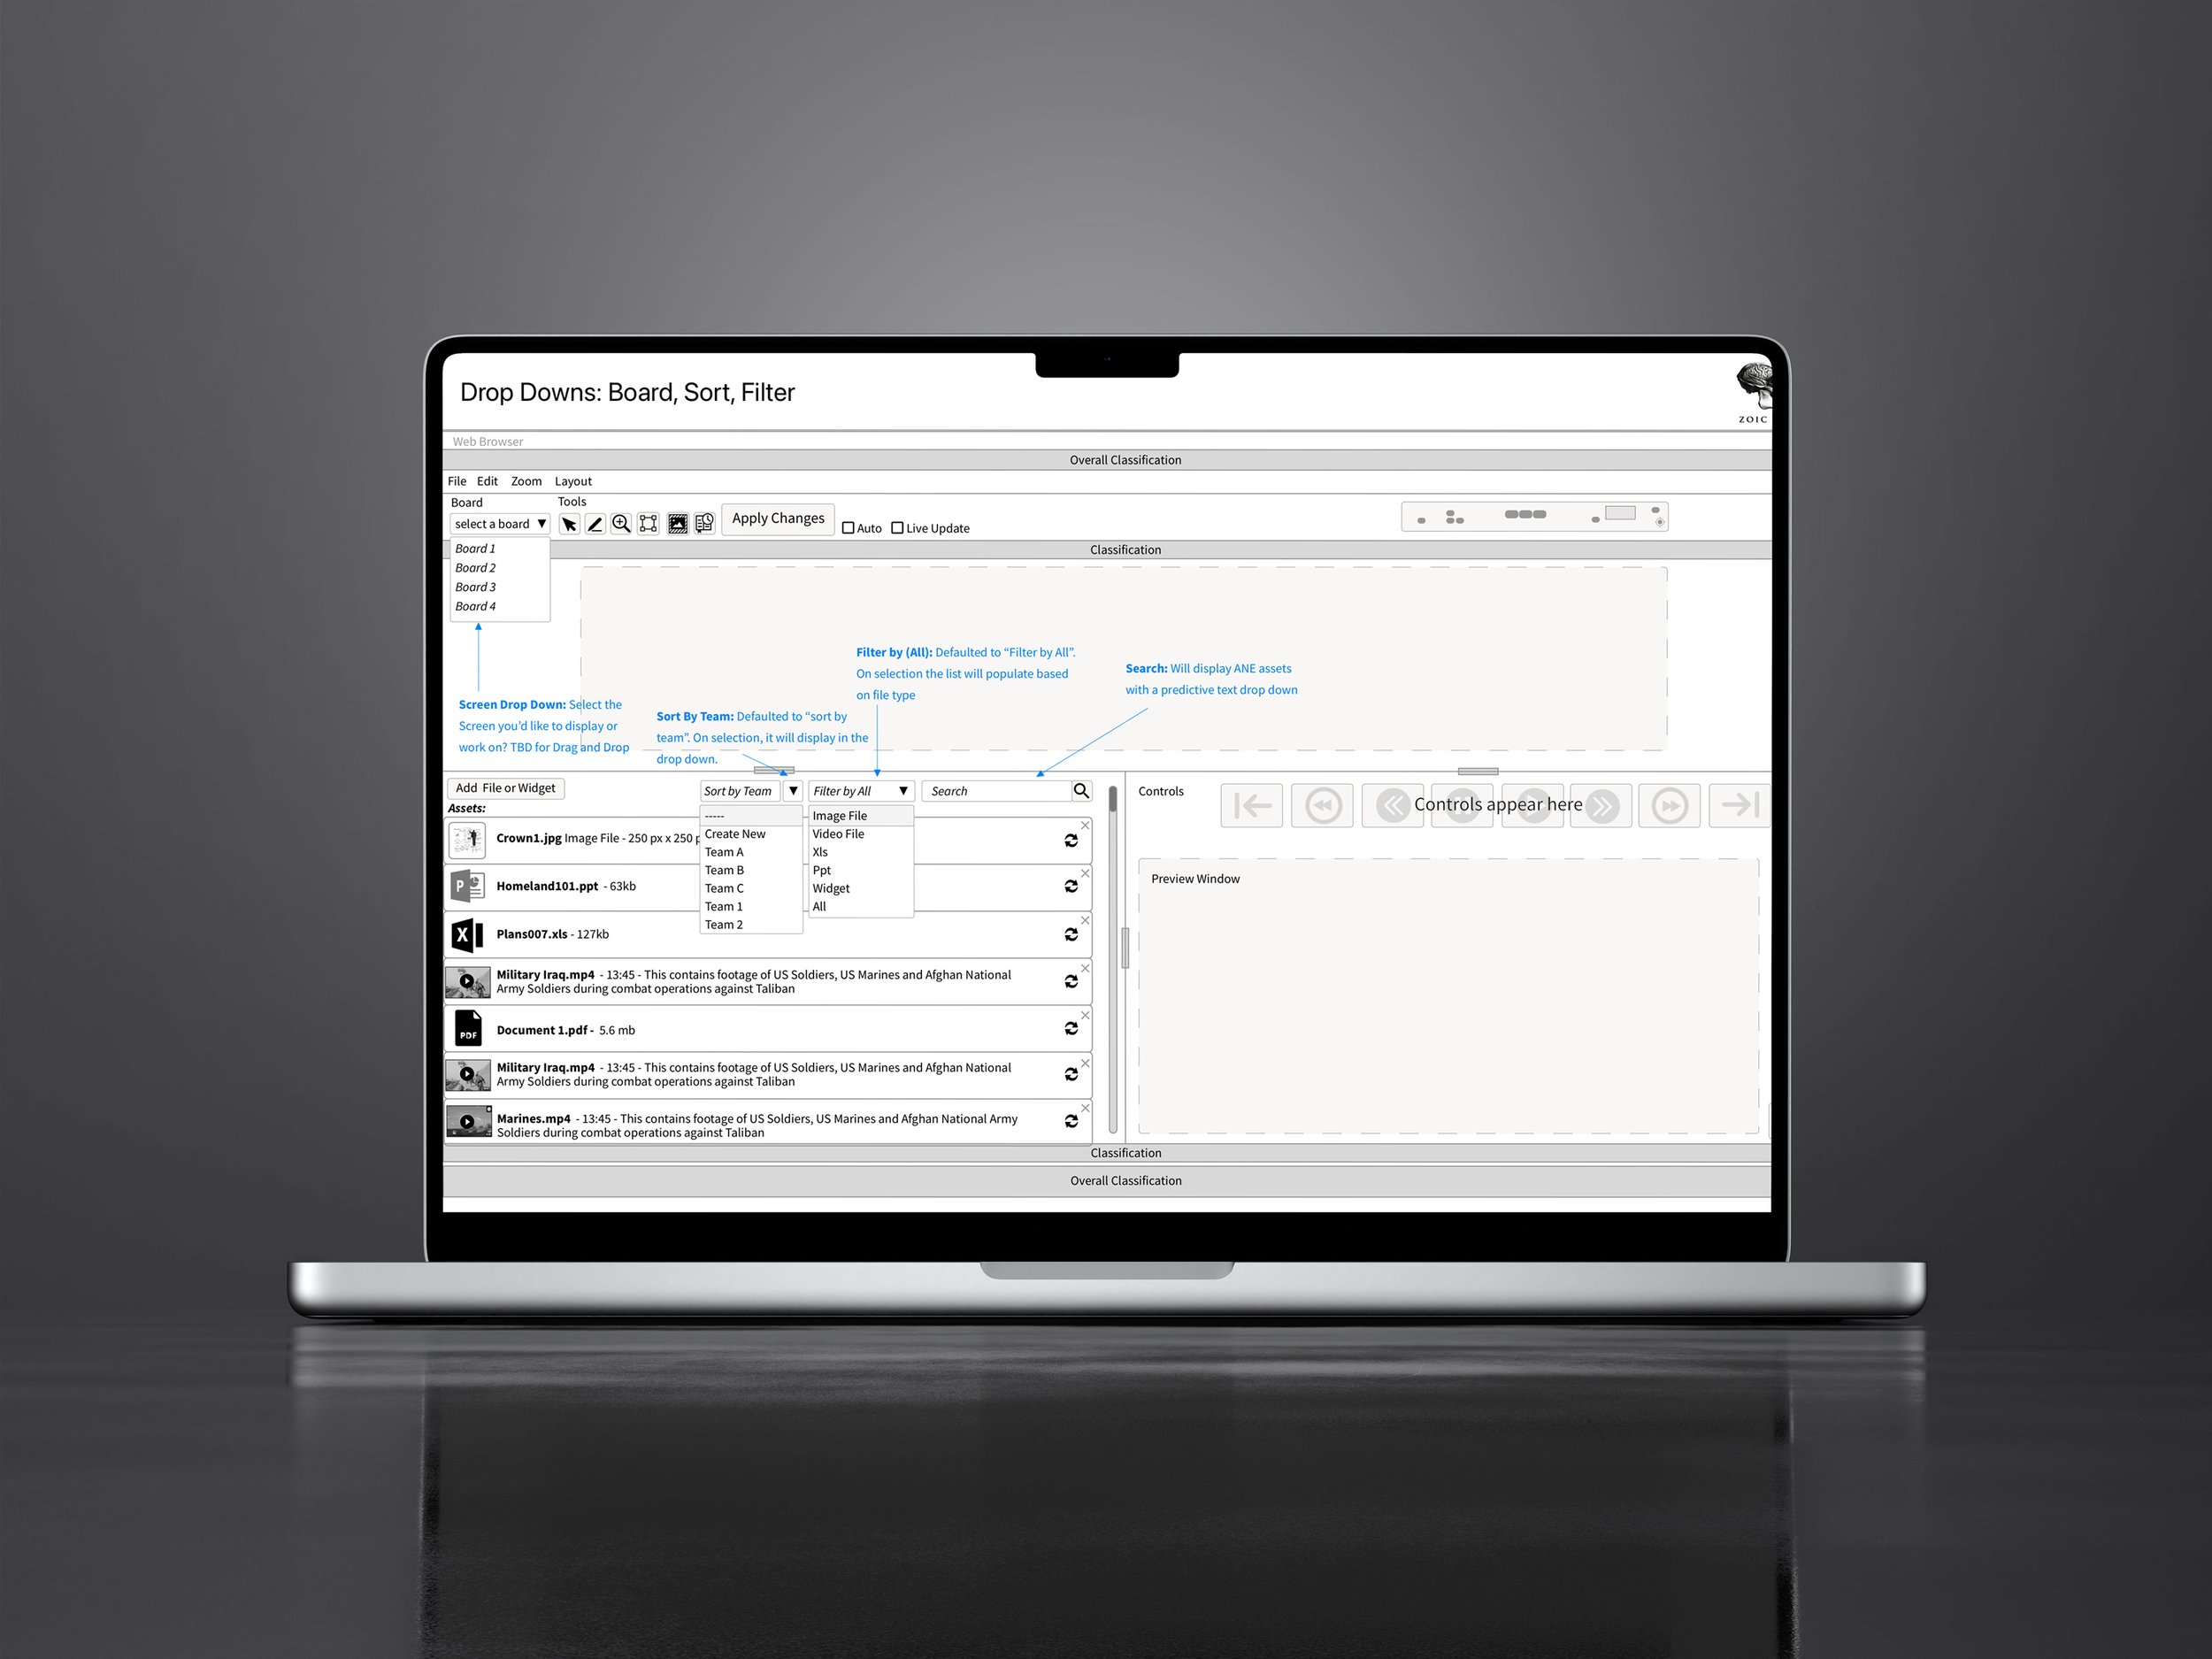
DropDowns
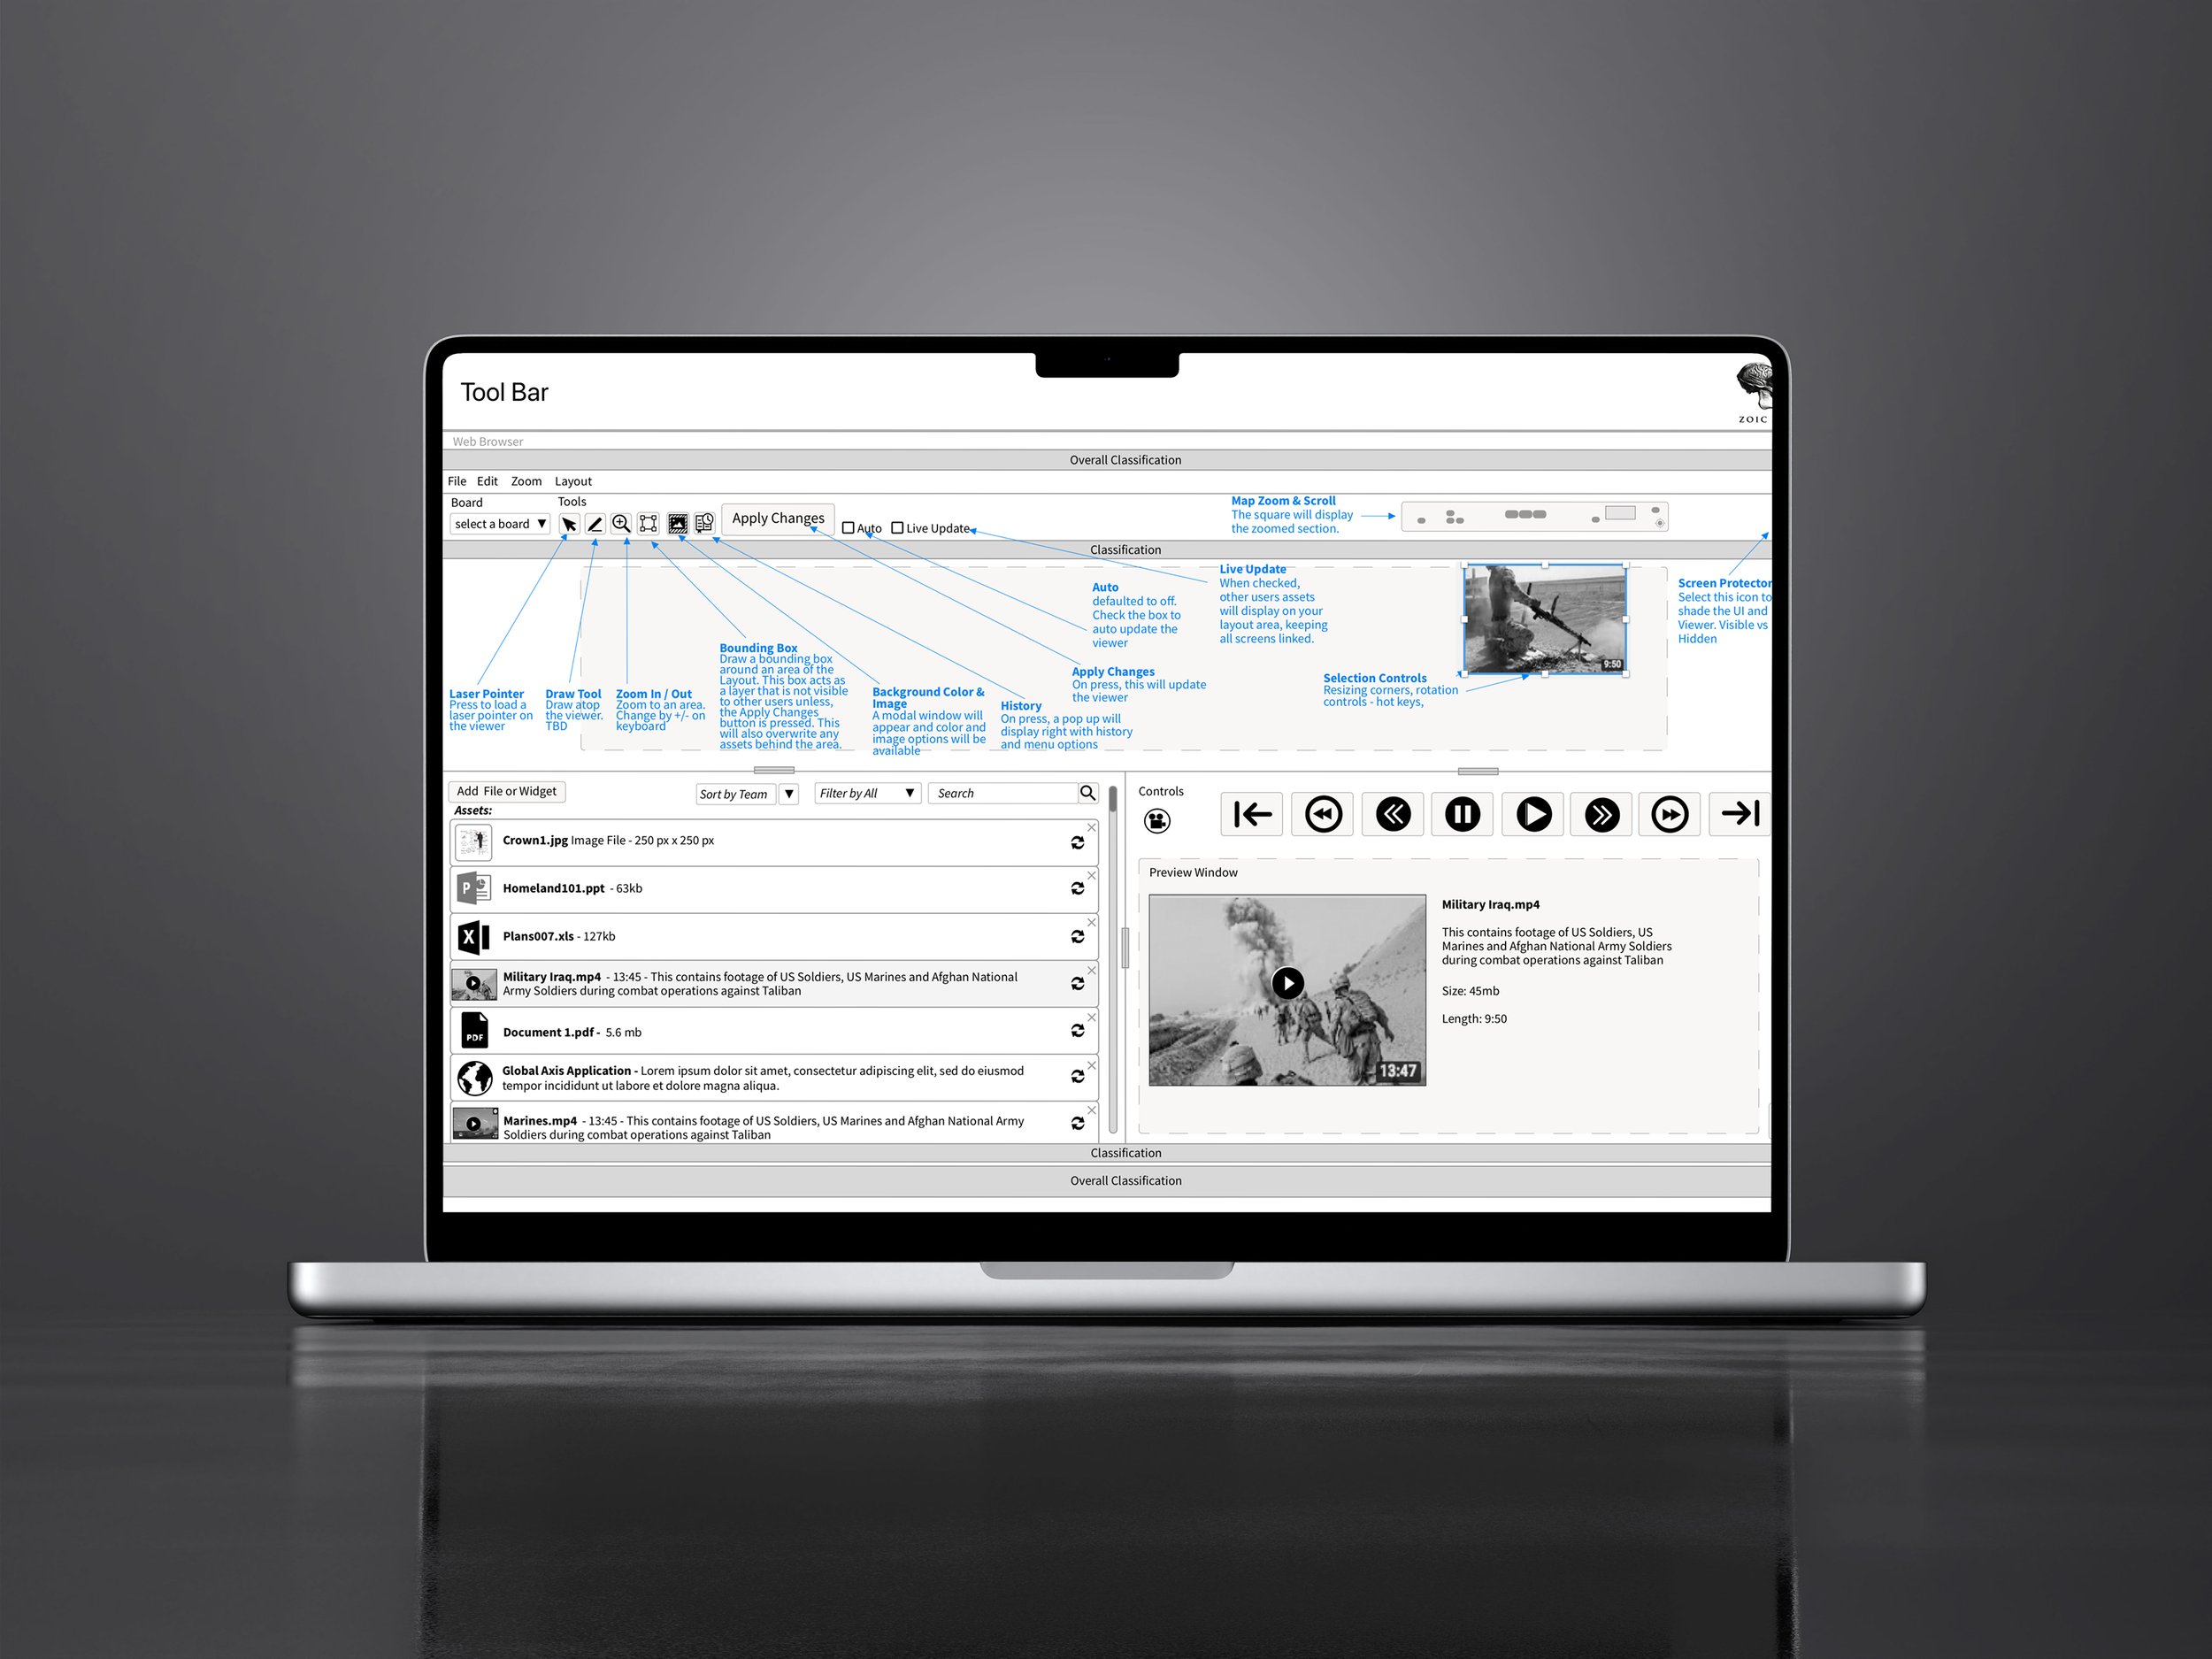
Tool Bar
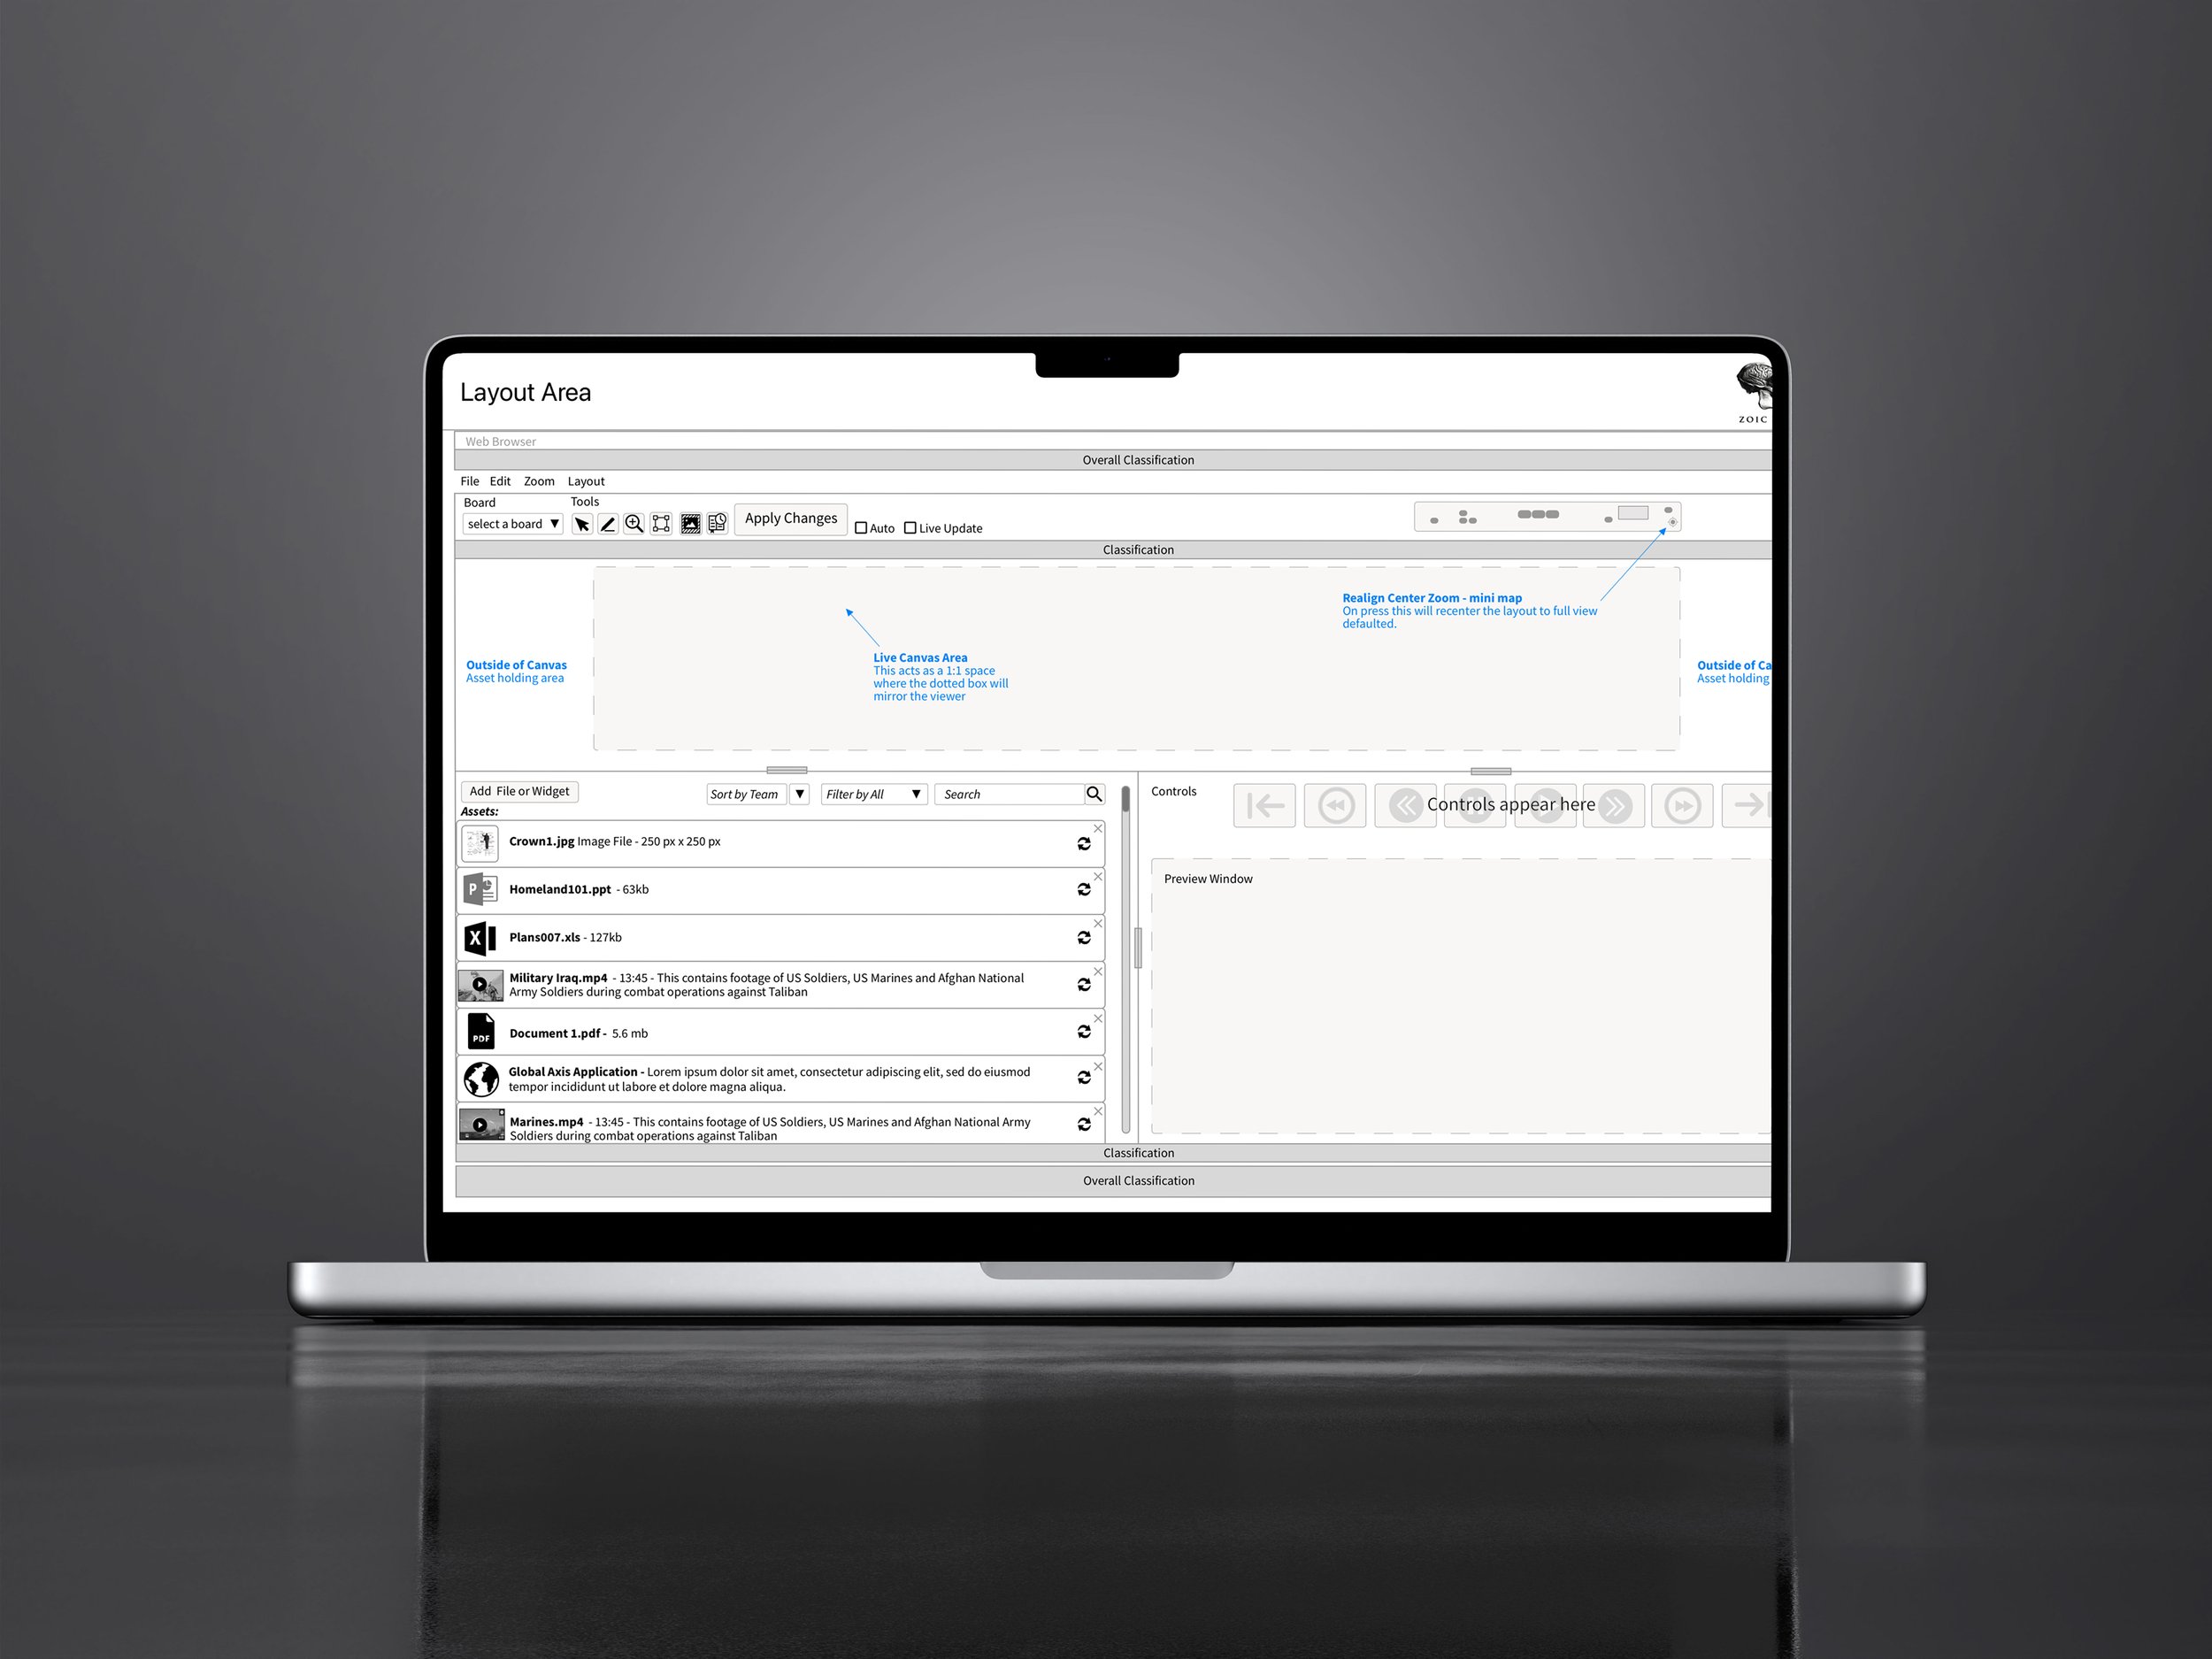
Layout Area
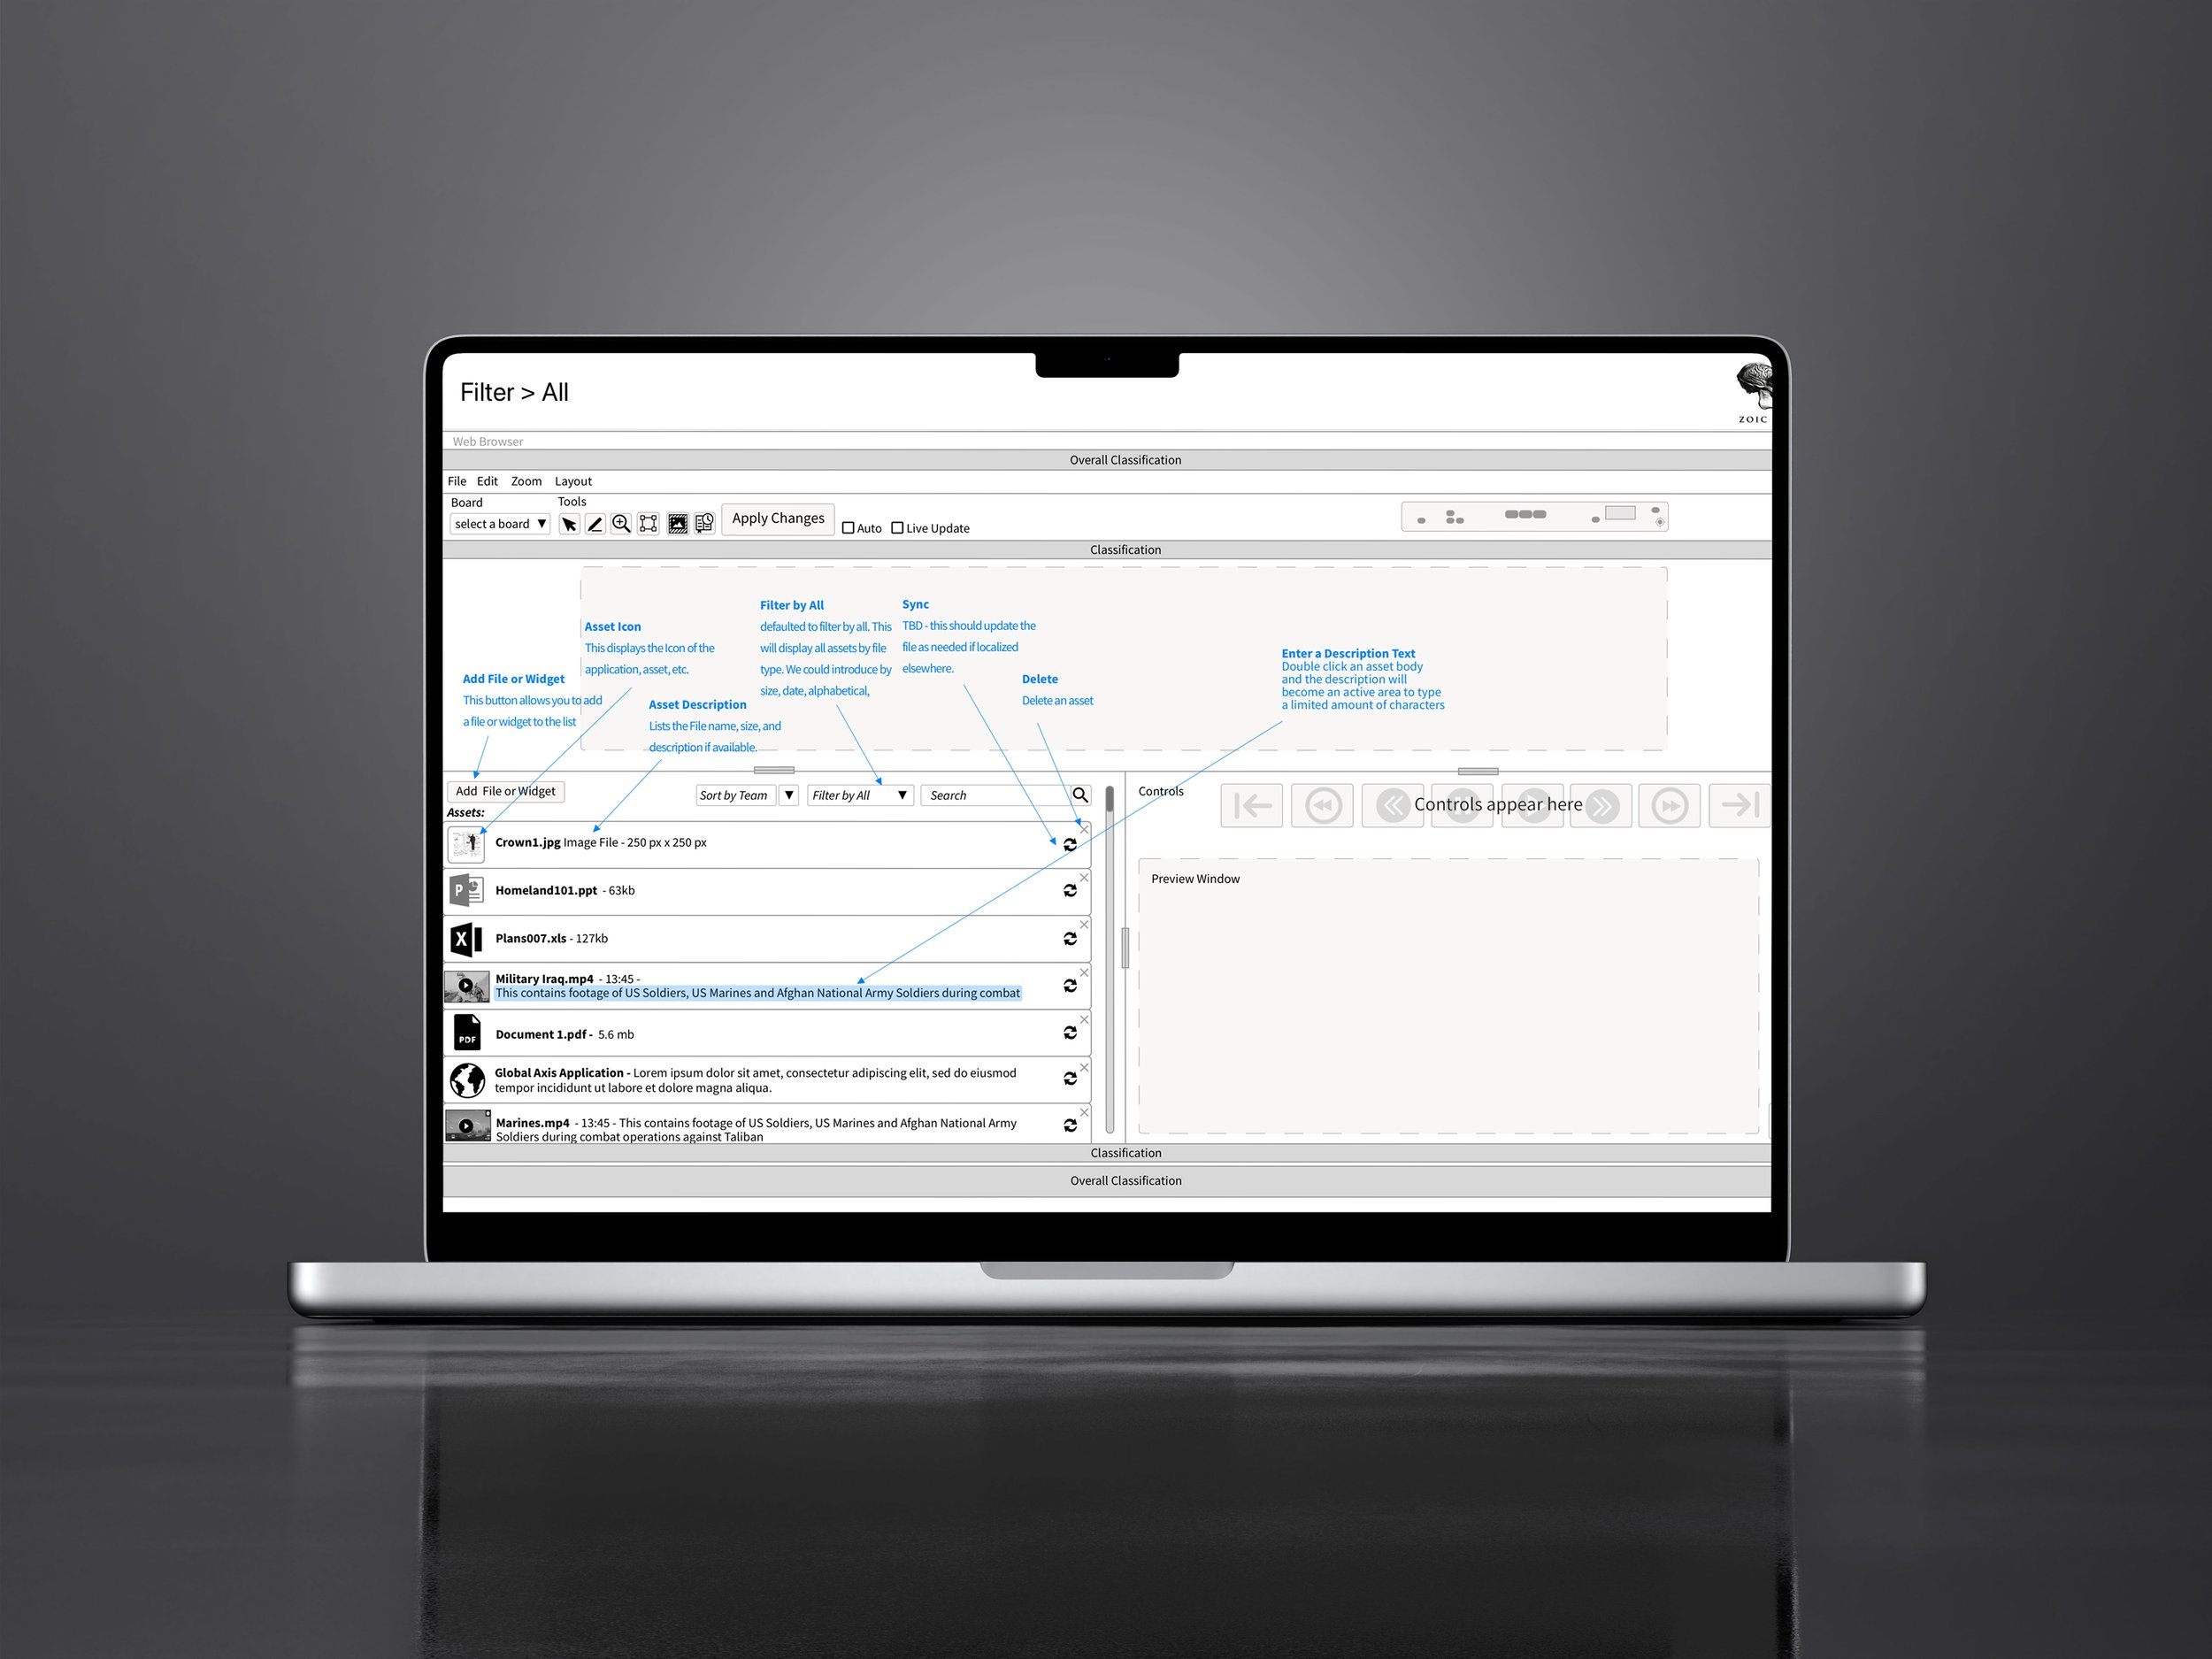
Filter by All
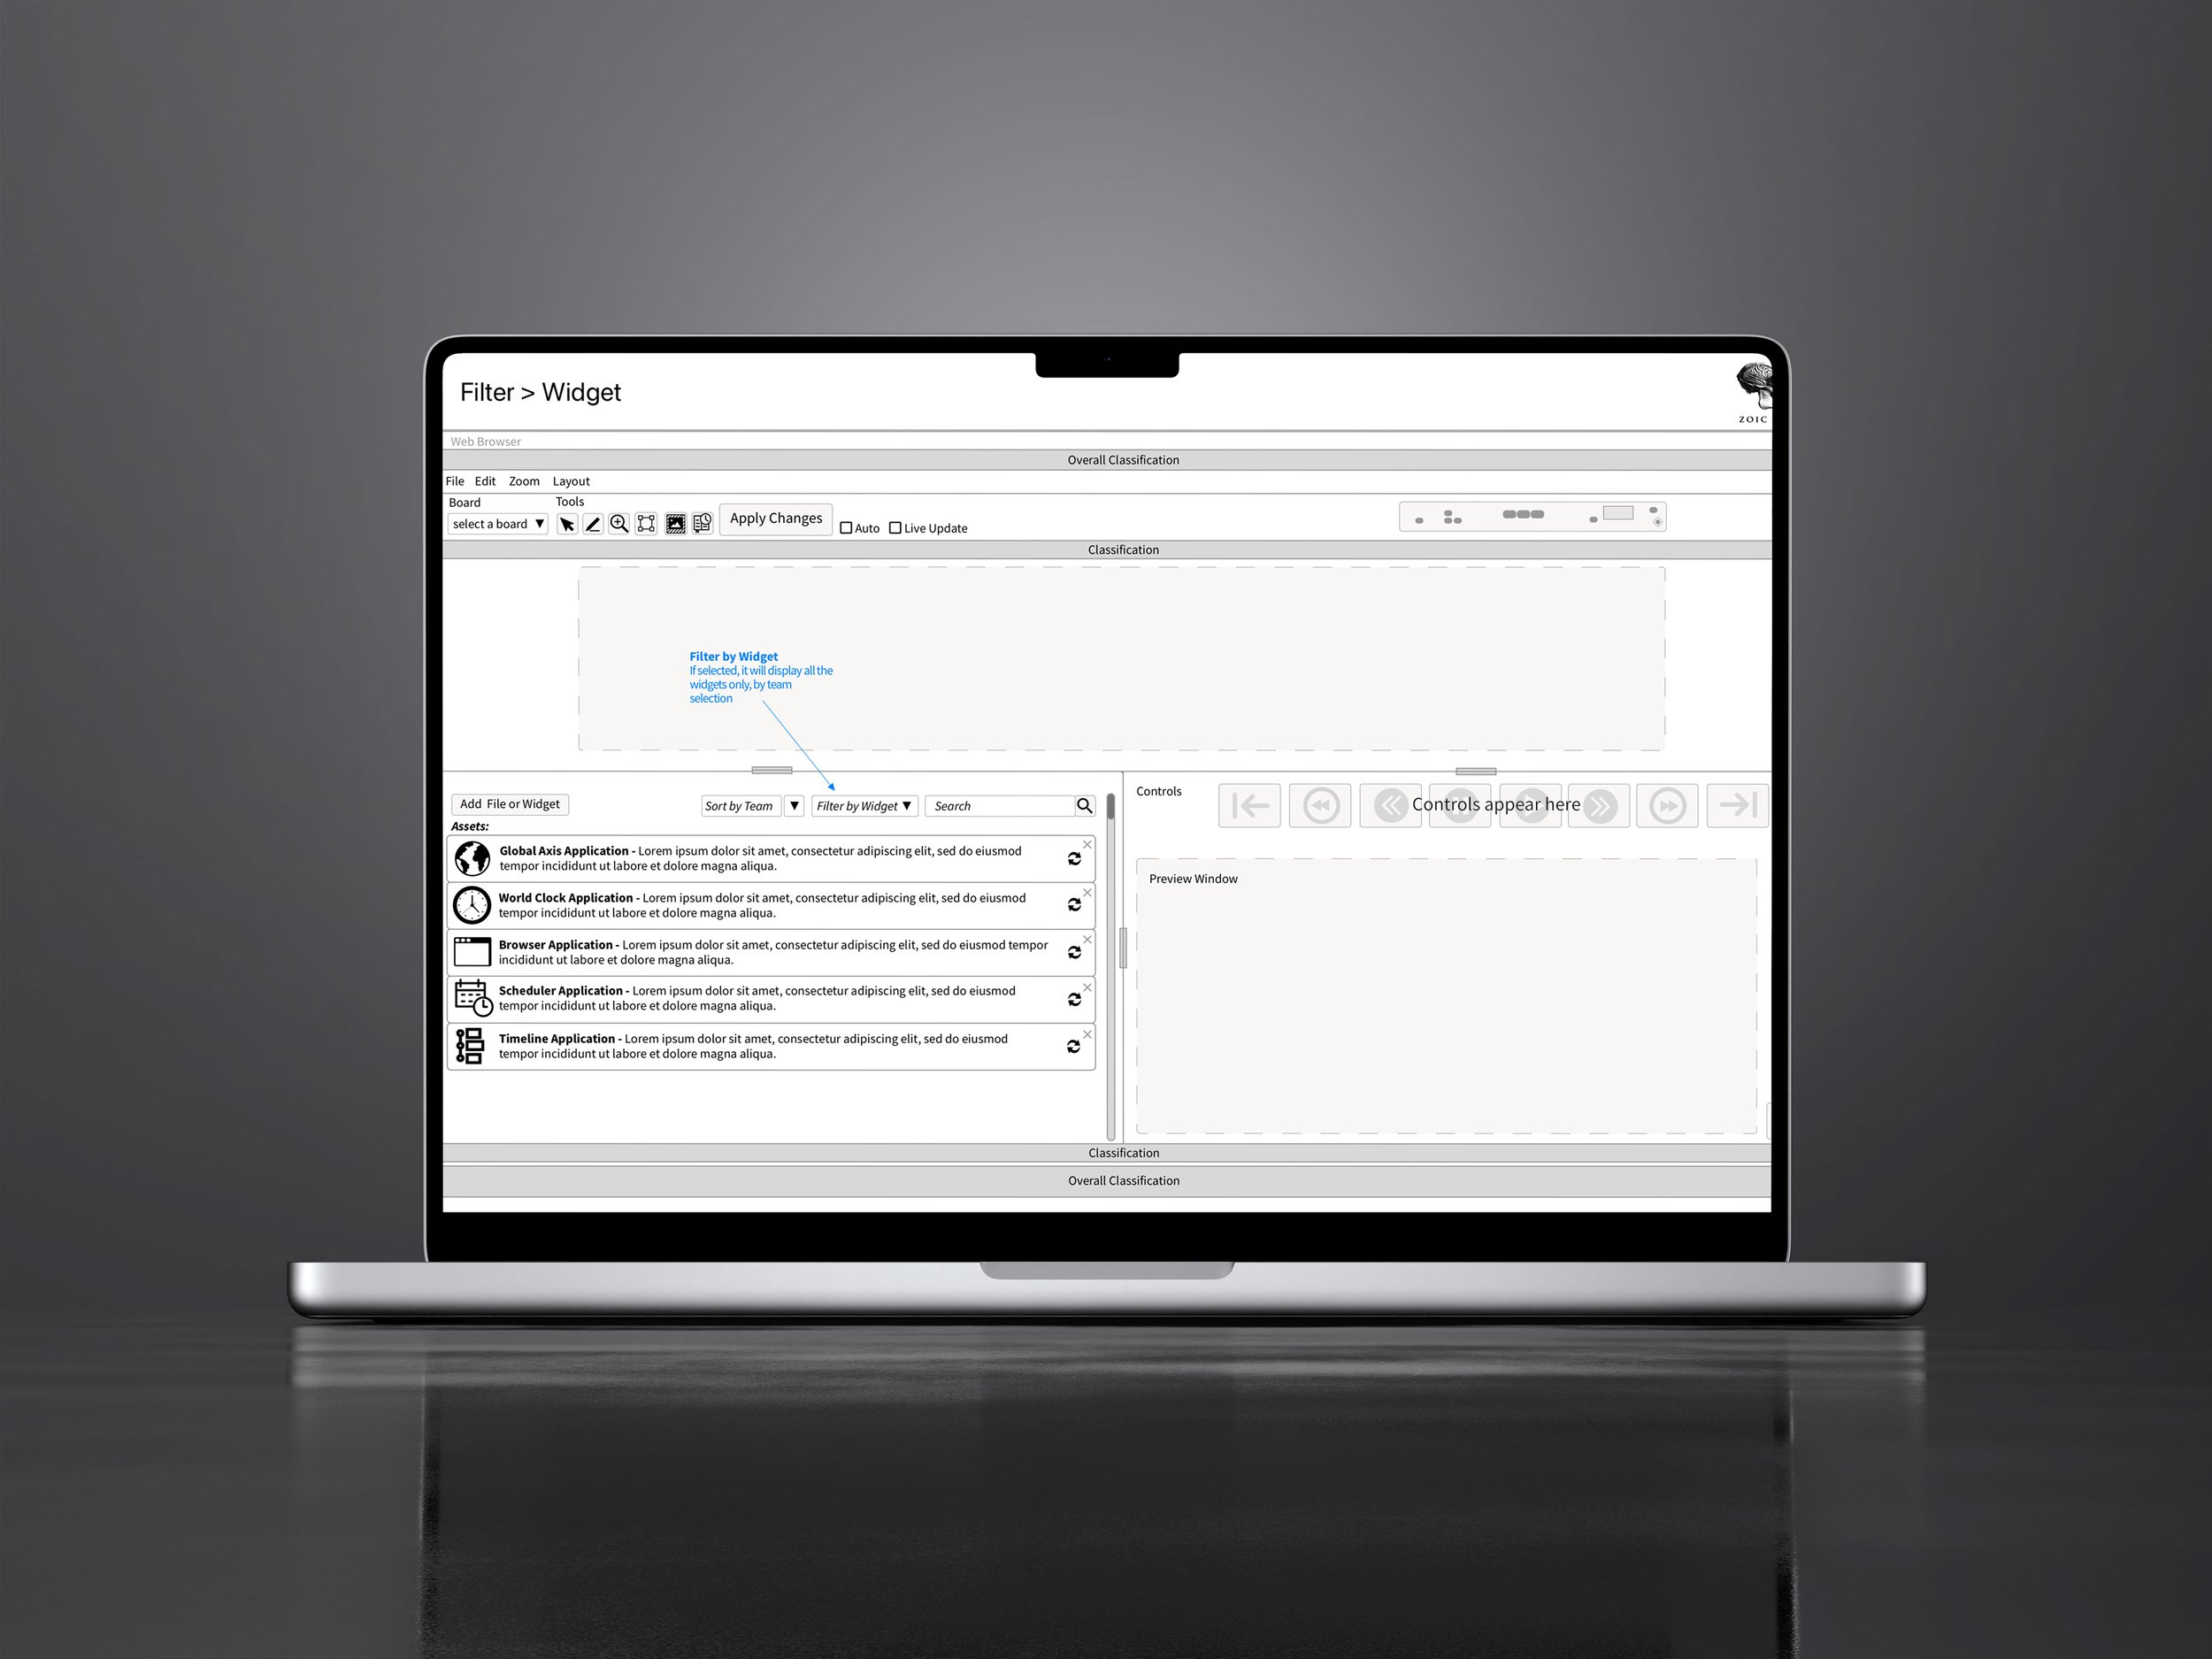
Filter by Widget
Controls Section
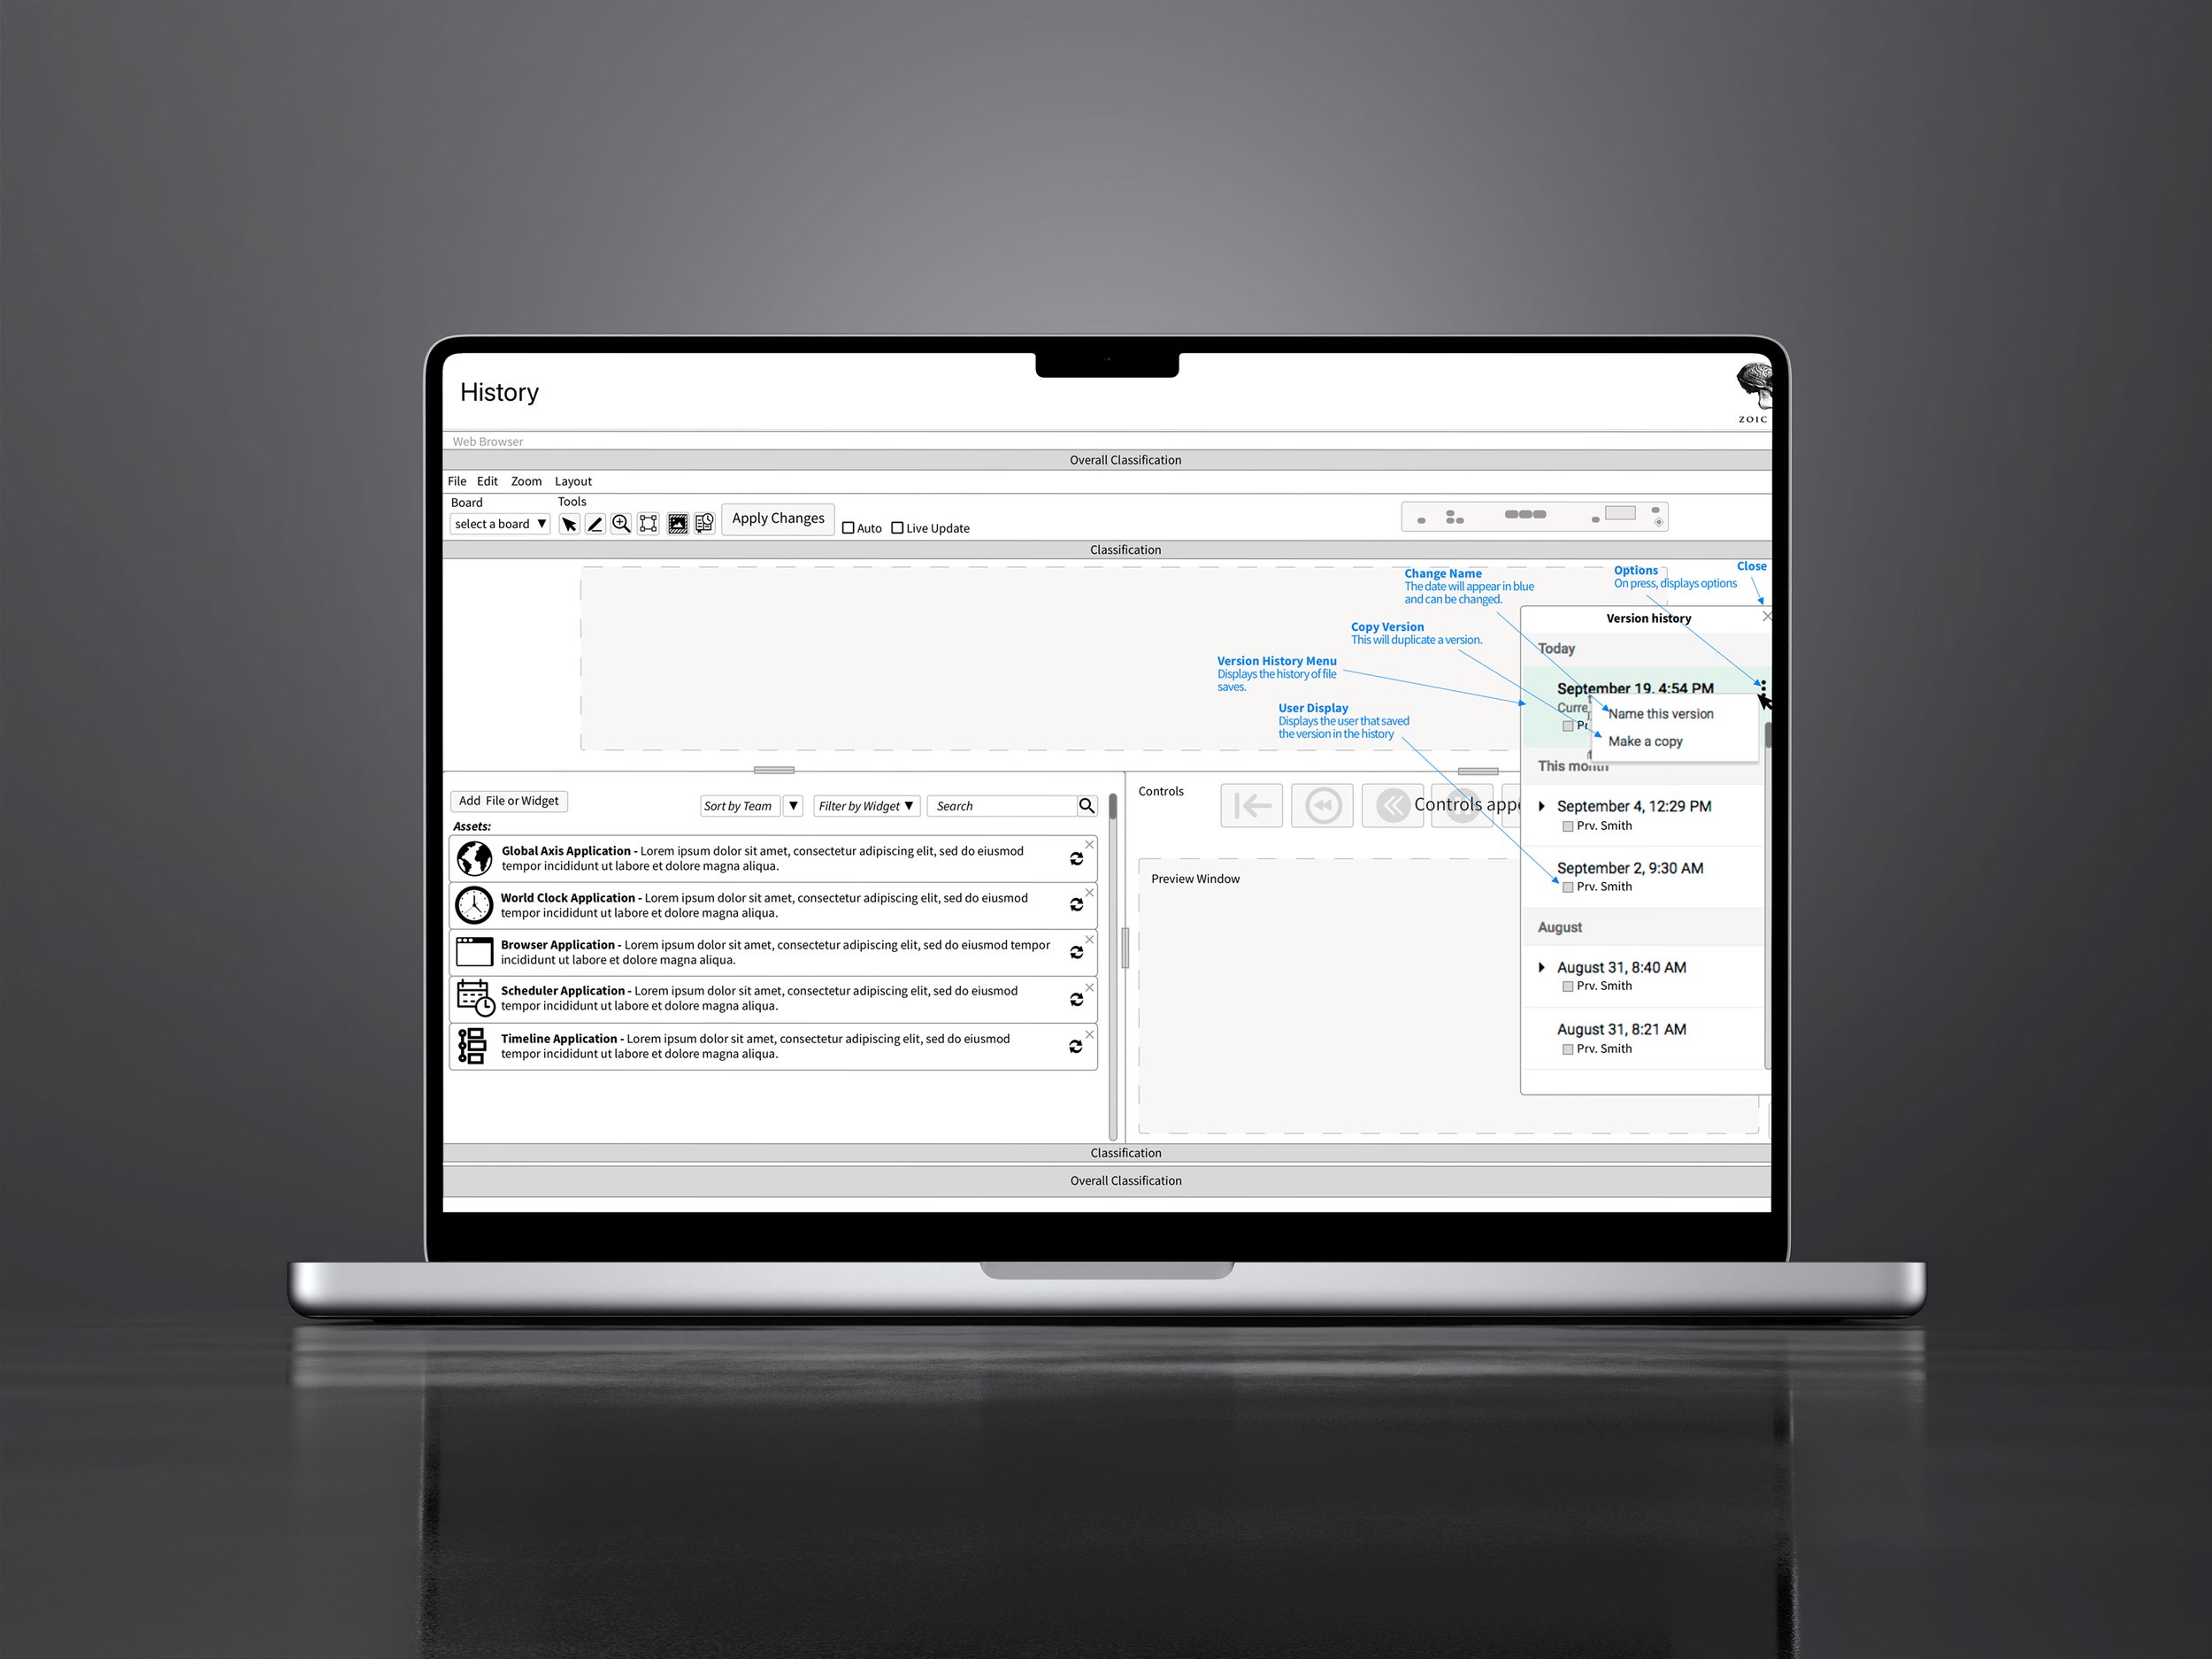
History - Recall Drawer
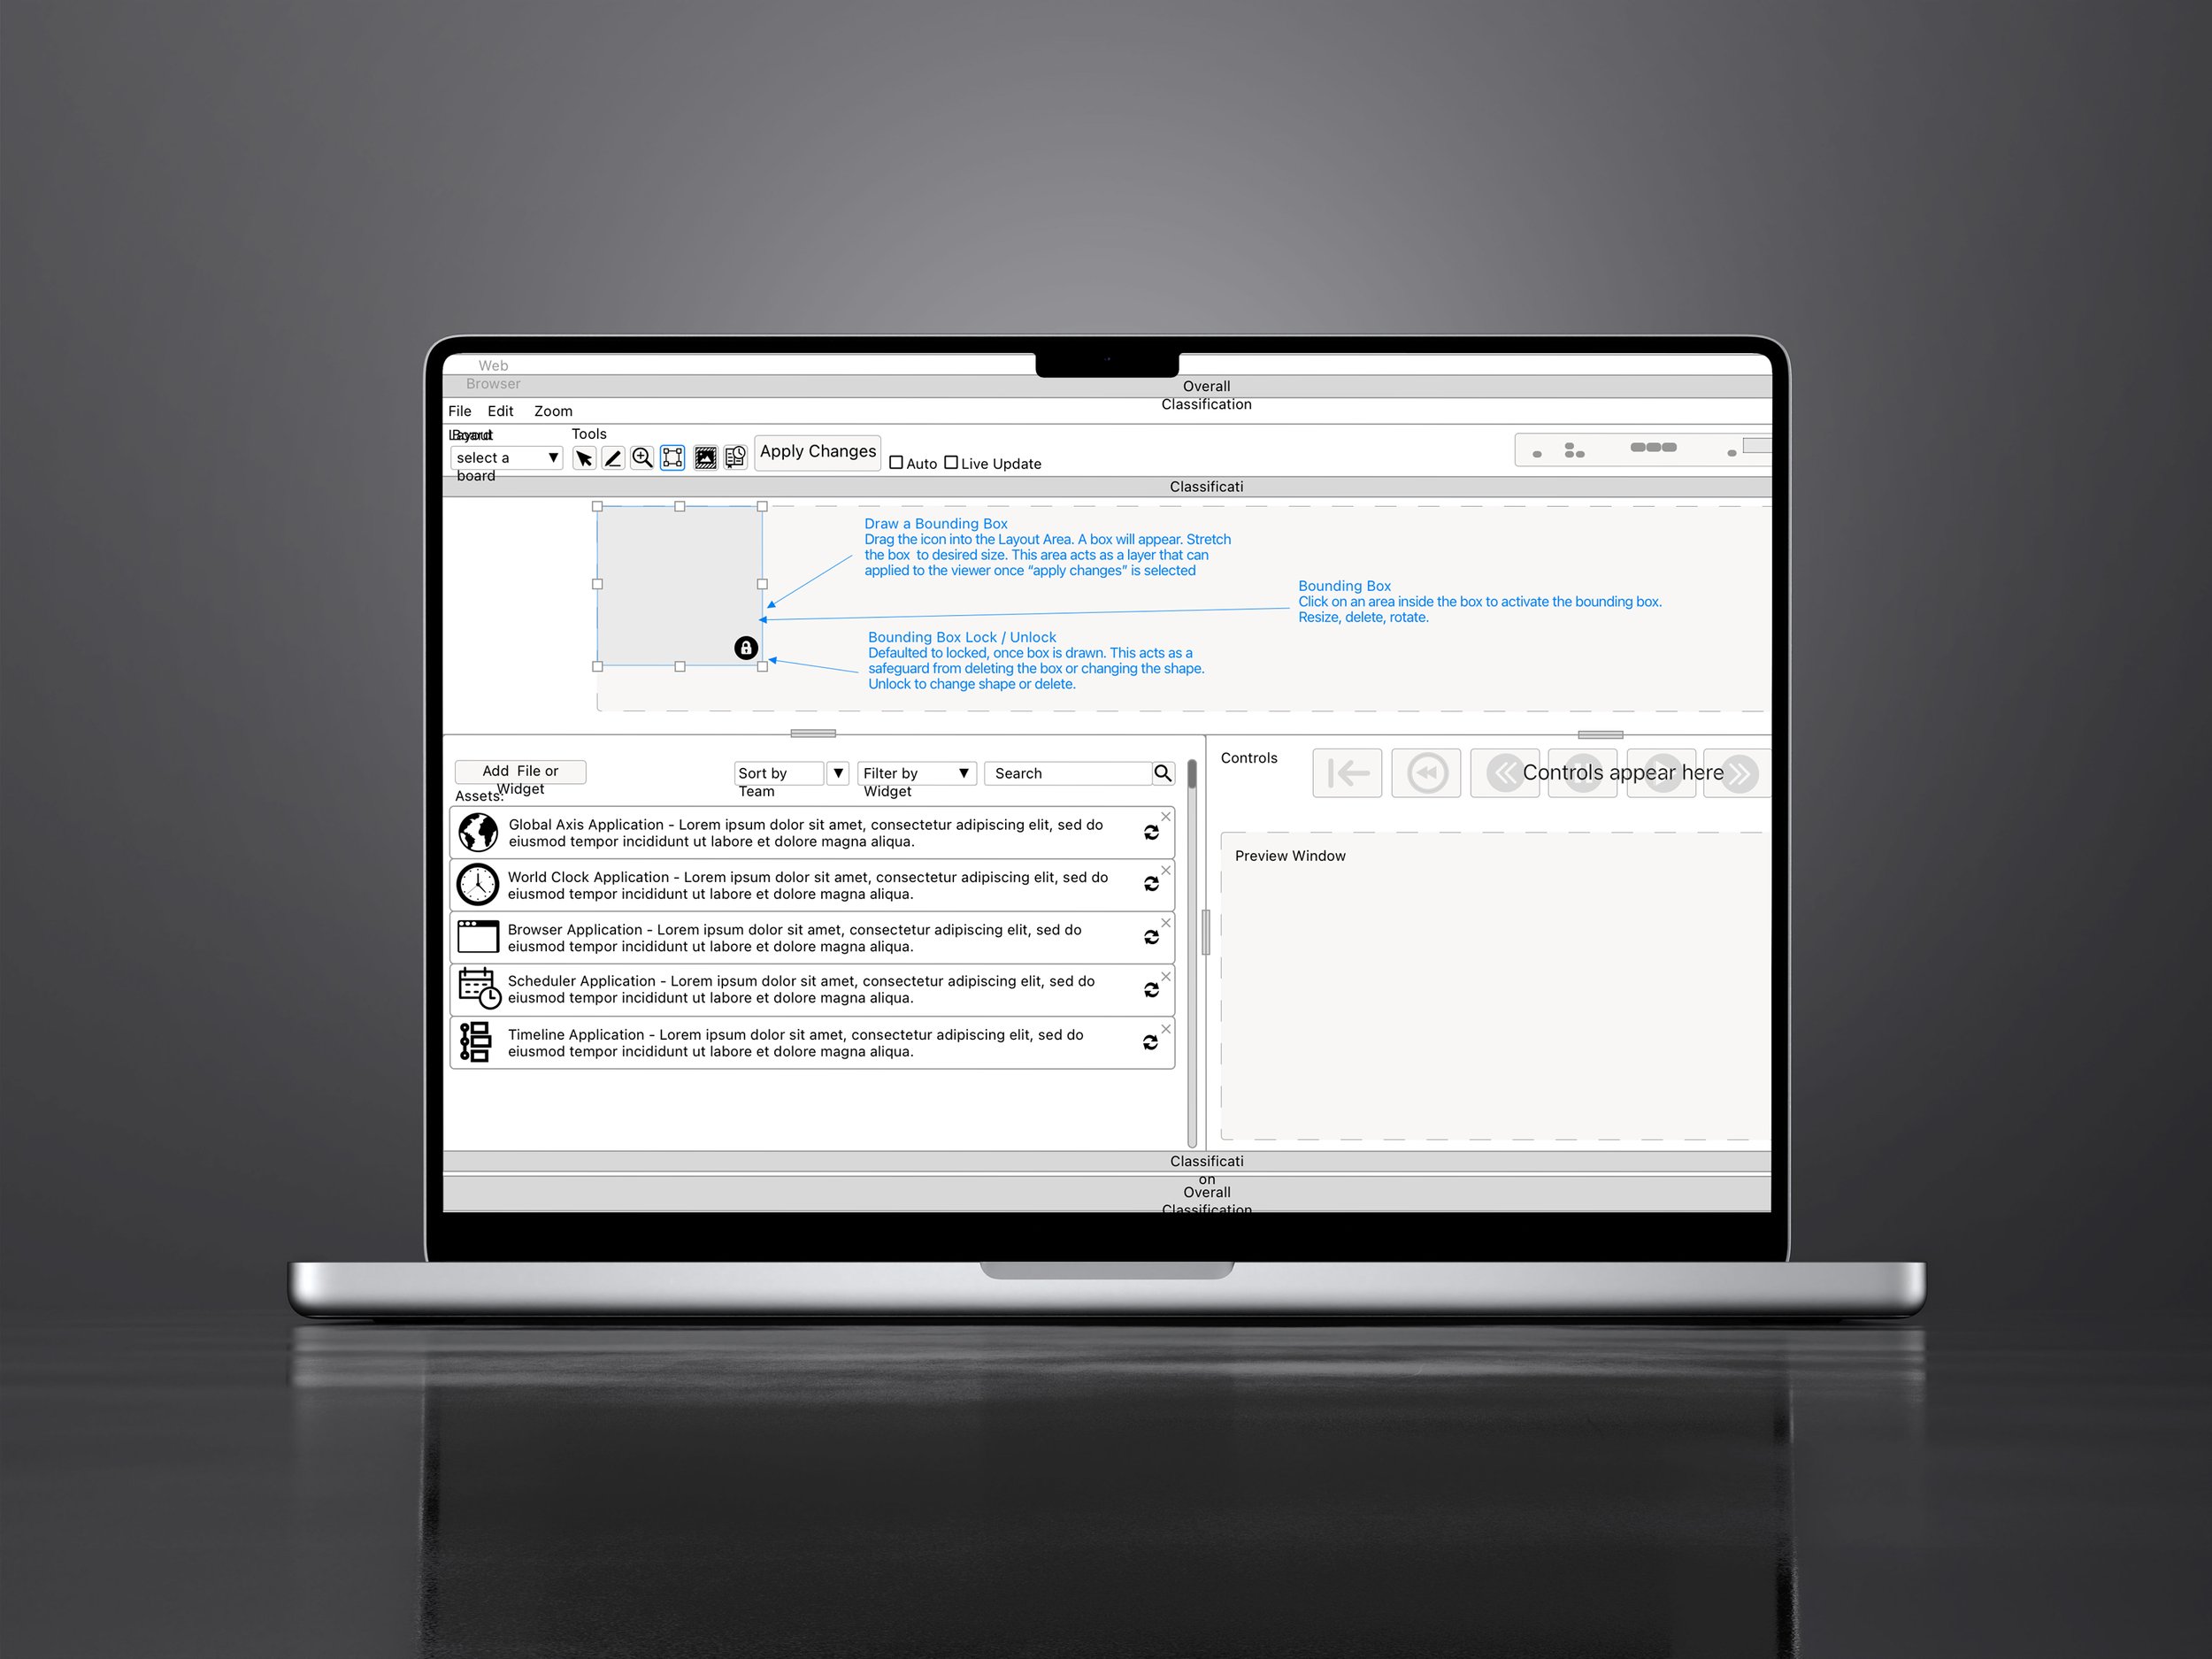
Bounding Box - Draw a box to add an element
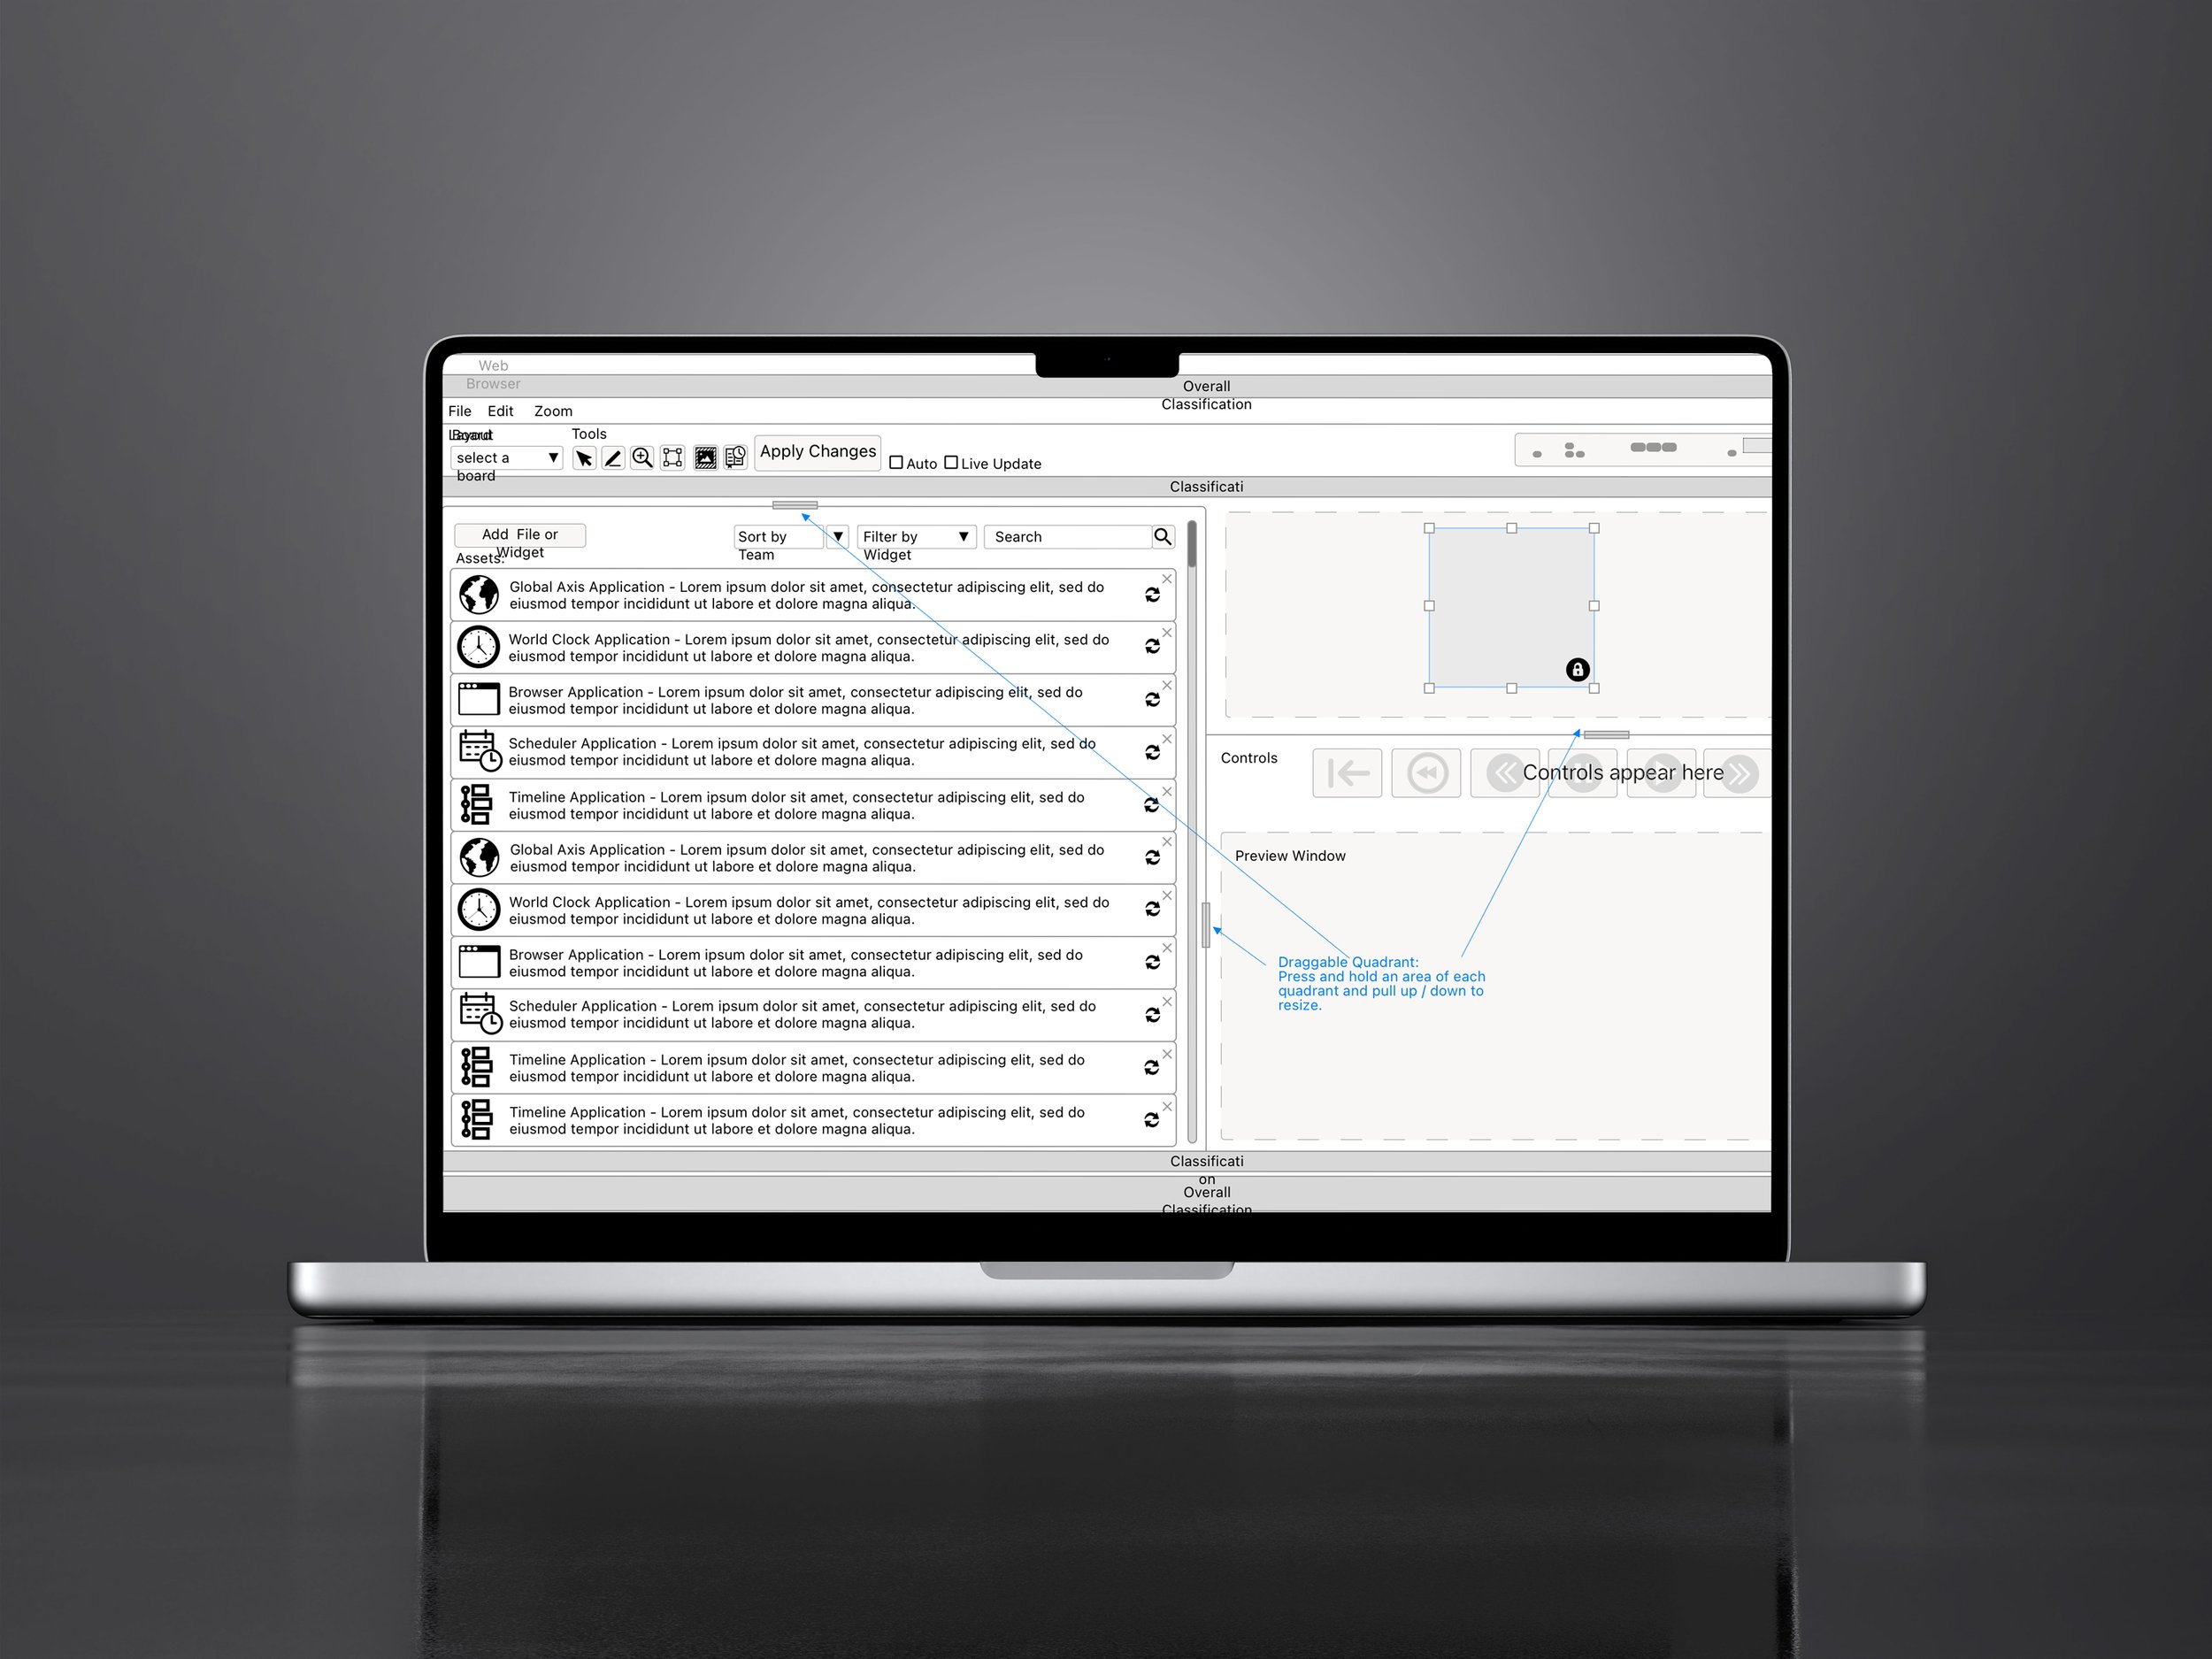
Draggable Quadrants
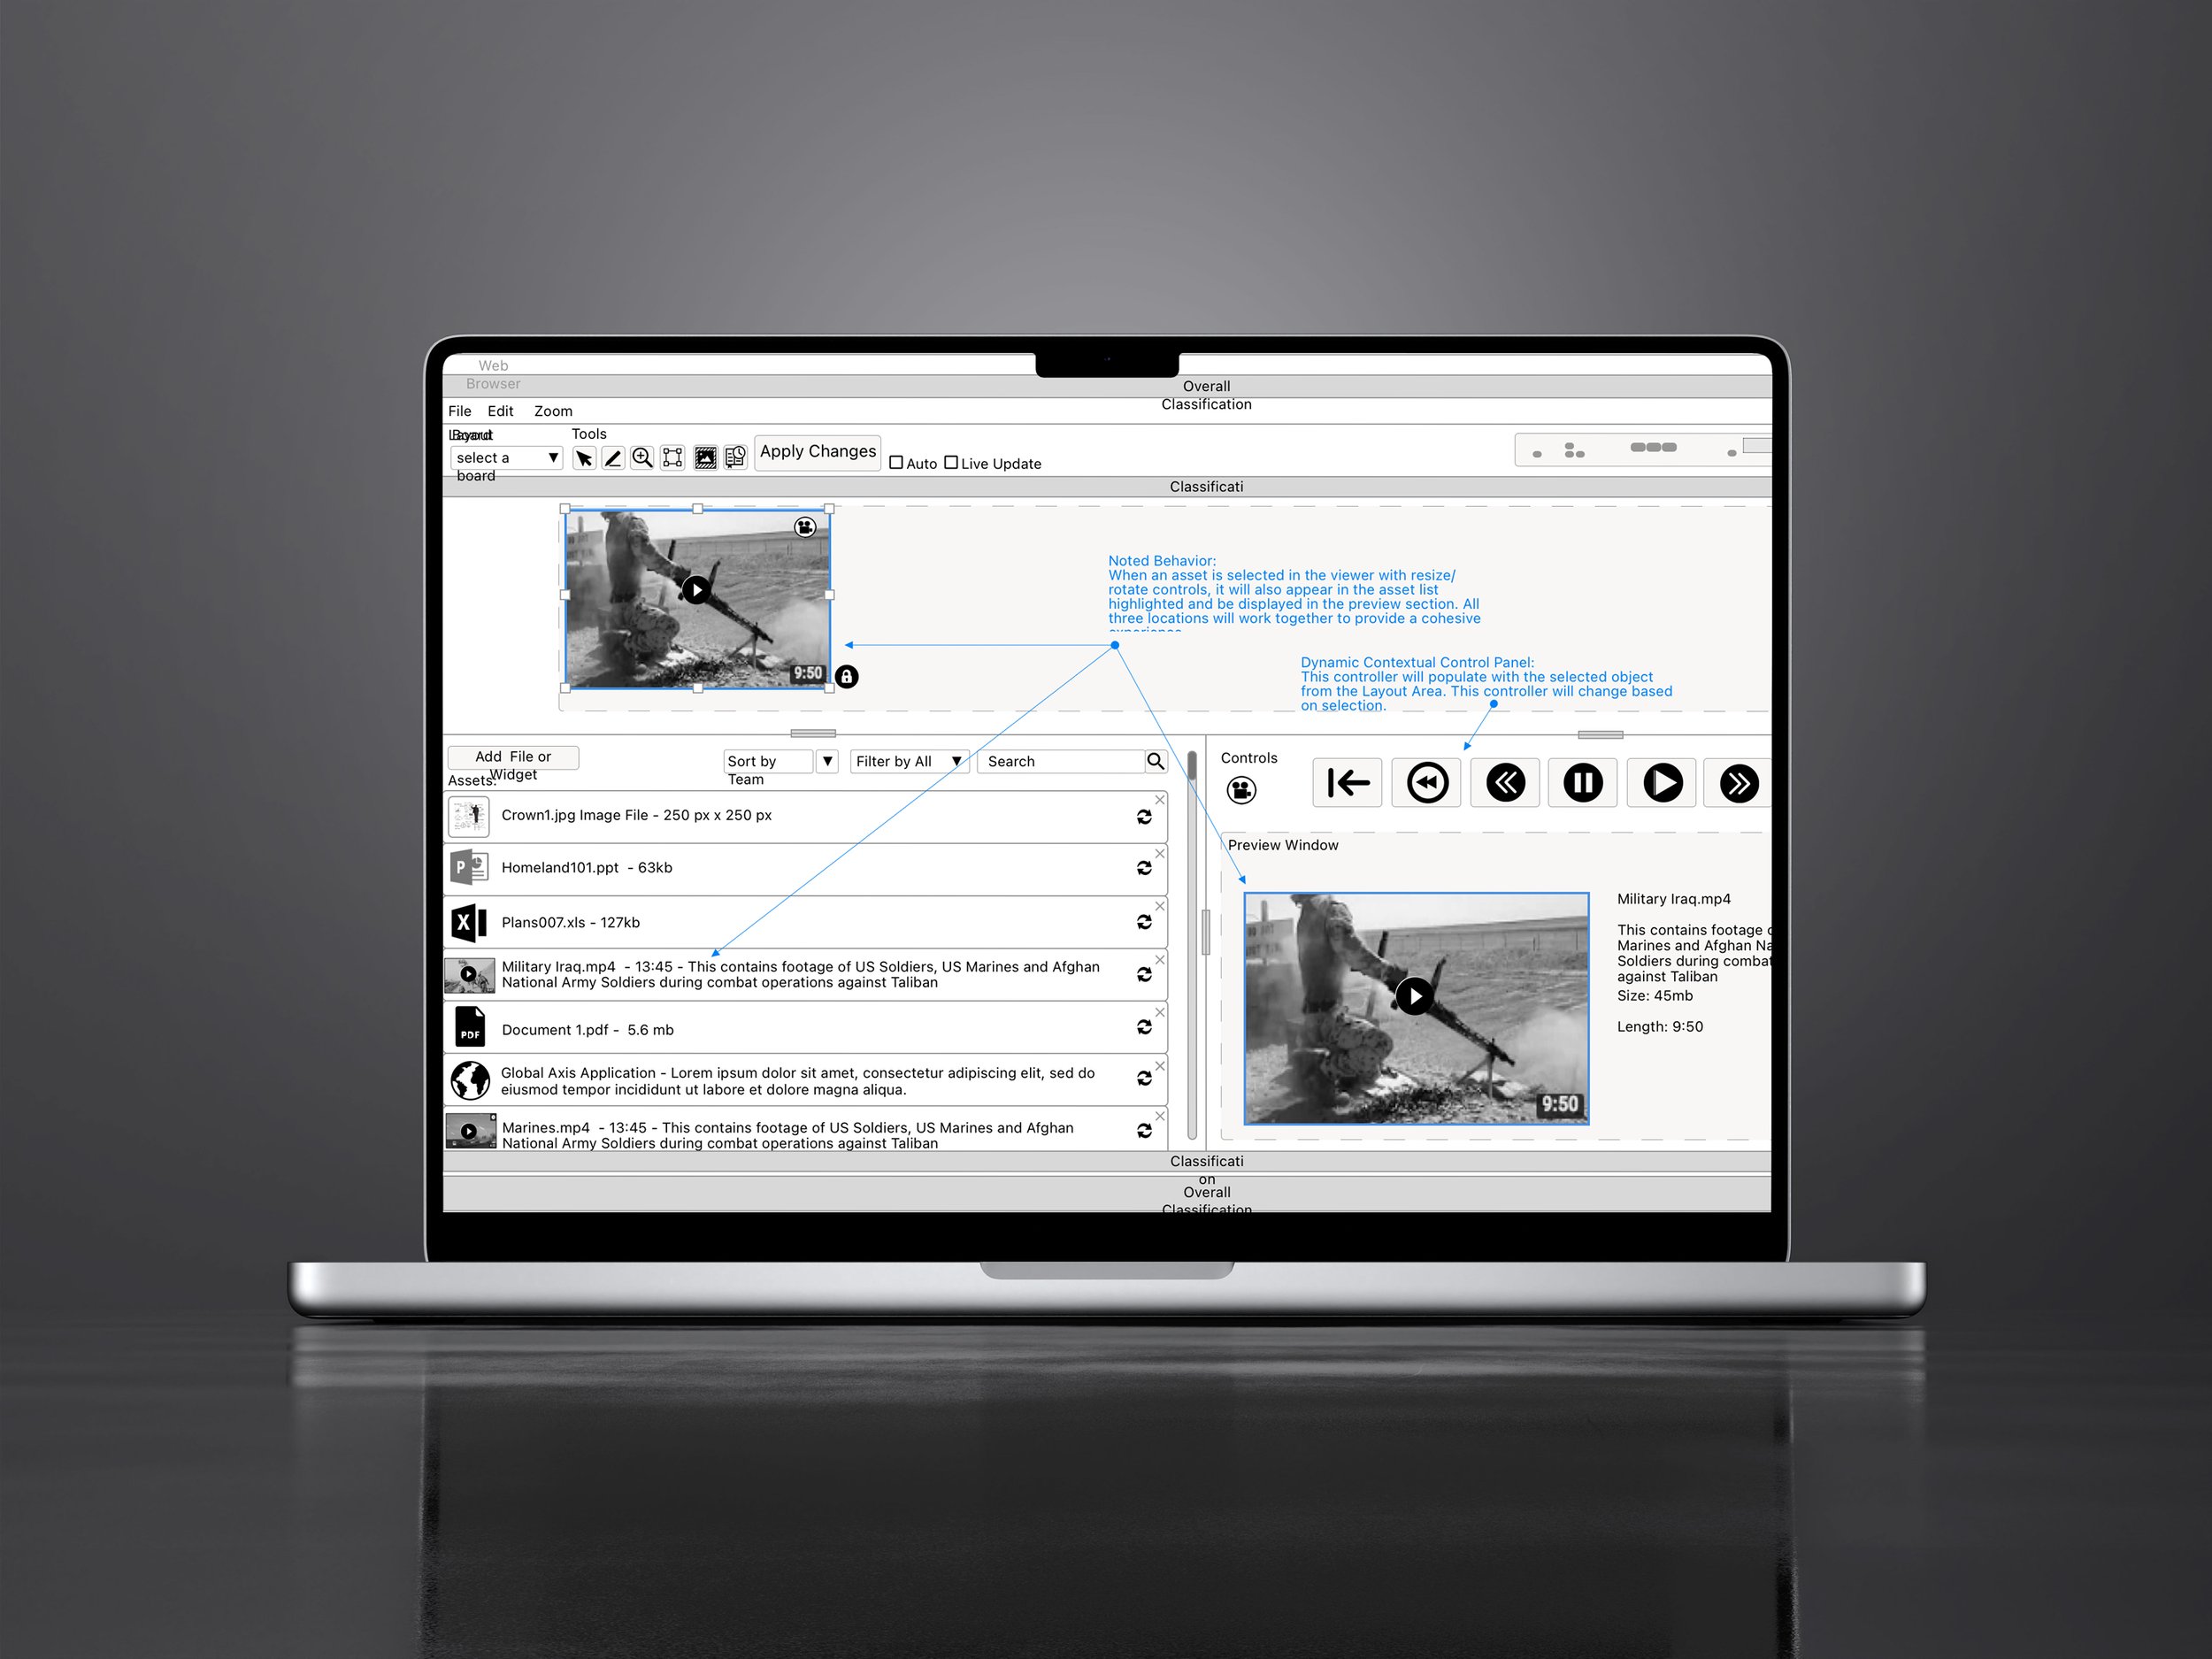
Dynamic Behavior

End Result
02
System architecture
Defining the UX Foundation Across All Three Tools
Screen-Sharing Architecture — Modeled how users switch between assets, manage layouts, and view feeds securely based on classification level.
BTC Simulation Framework — Built structural patterns for sentiment overlays, time-series controls, and multi-panel analysis.
Orbital Debris Mapping Model — Established geospatial hierarchy, layer controls, and trajectory representations for space-object tracking.
Modular Interaction Patterns — Created shared UI components to keep the three products consistent and scalable.


03
Design & prototyping
Bringing Complex Visual Systems to Life
Classification UI in Action — High-fidelity interfaces showing live video, imagery, telemetry, and mapping tools inside a controlled-access viewer.
BTC Simulation Visual Design — Data-rich layouts for sentiment scoring, market deltas, comparative timelines, and prediction flows.
Orbital Debris Visualization — Prototyped object paths, altitude bands, orbital decay, velocity states, and data-point inspection.
Orbital Debris Visualization — Prototyped object paths, altitude bands, orbital decay, velocity states, and data-point inspection.
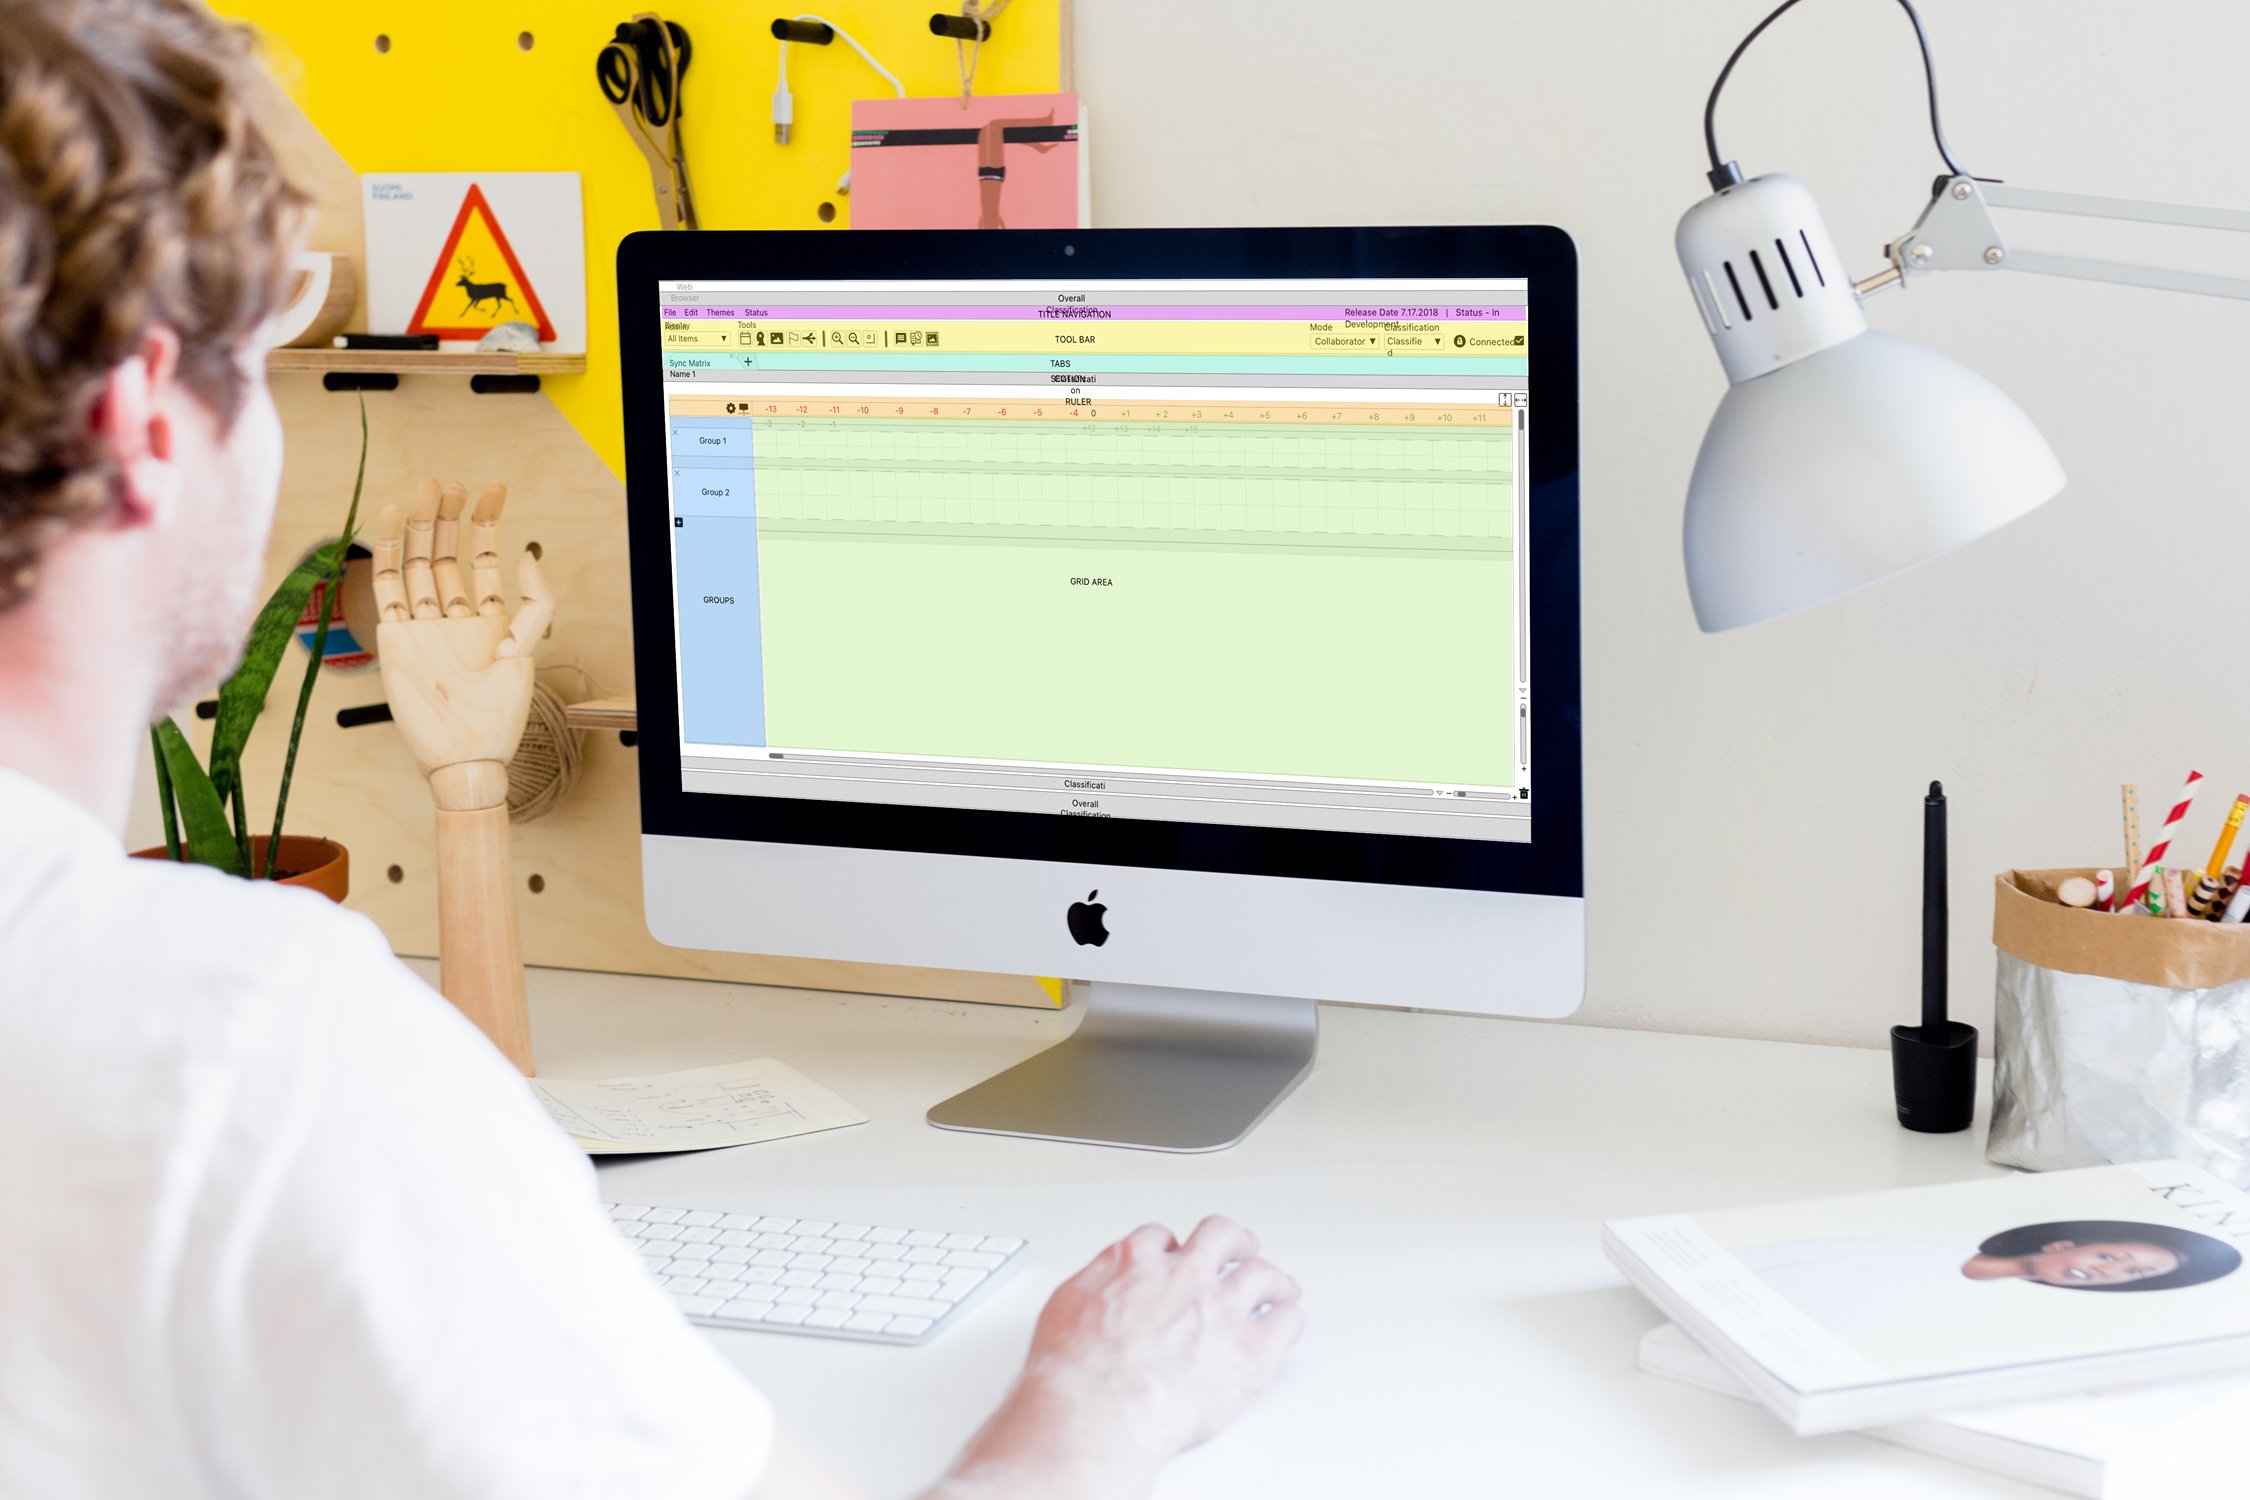
Sync Matrix - Box Diagram
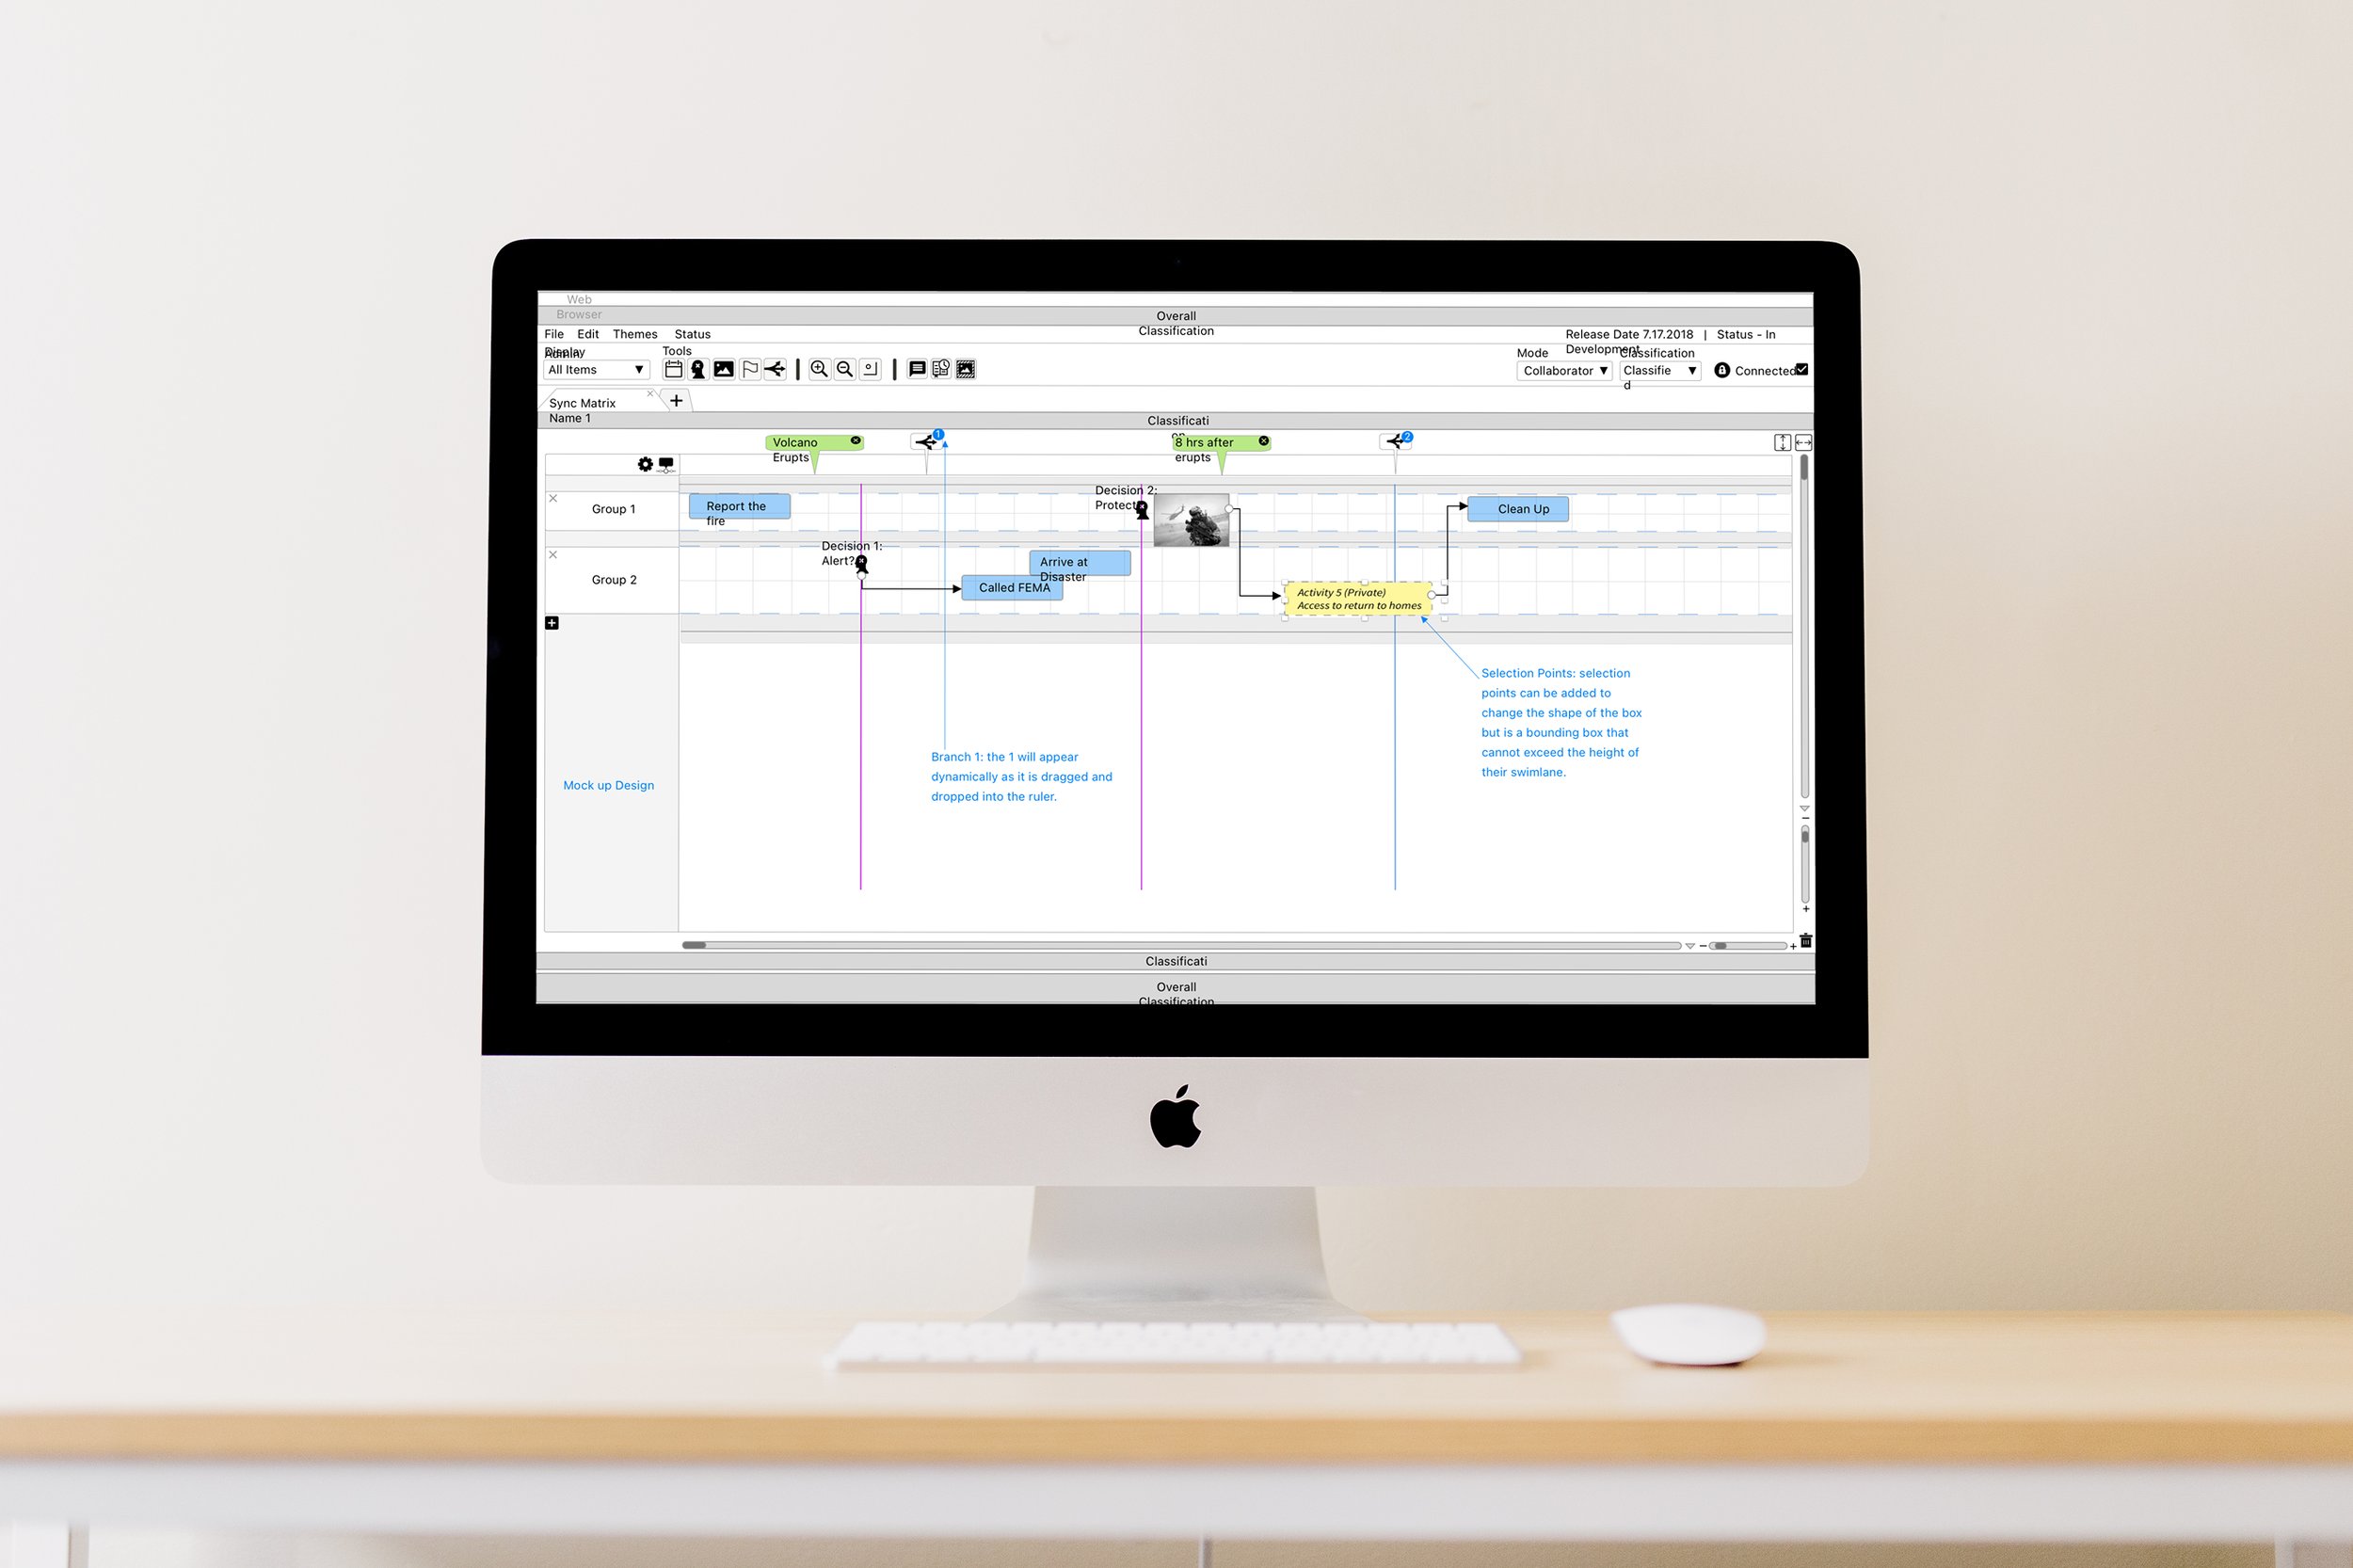
Sync Matrix - Mock Up Design
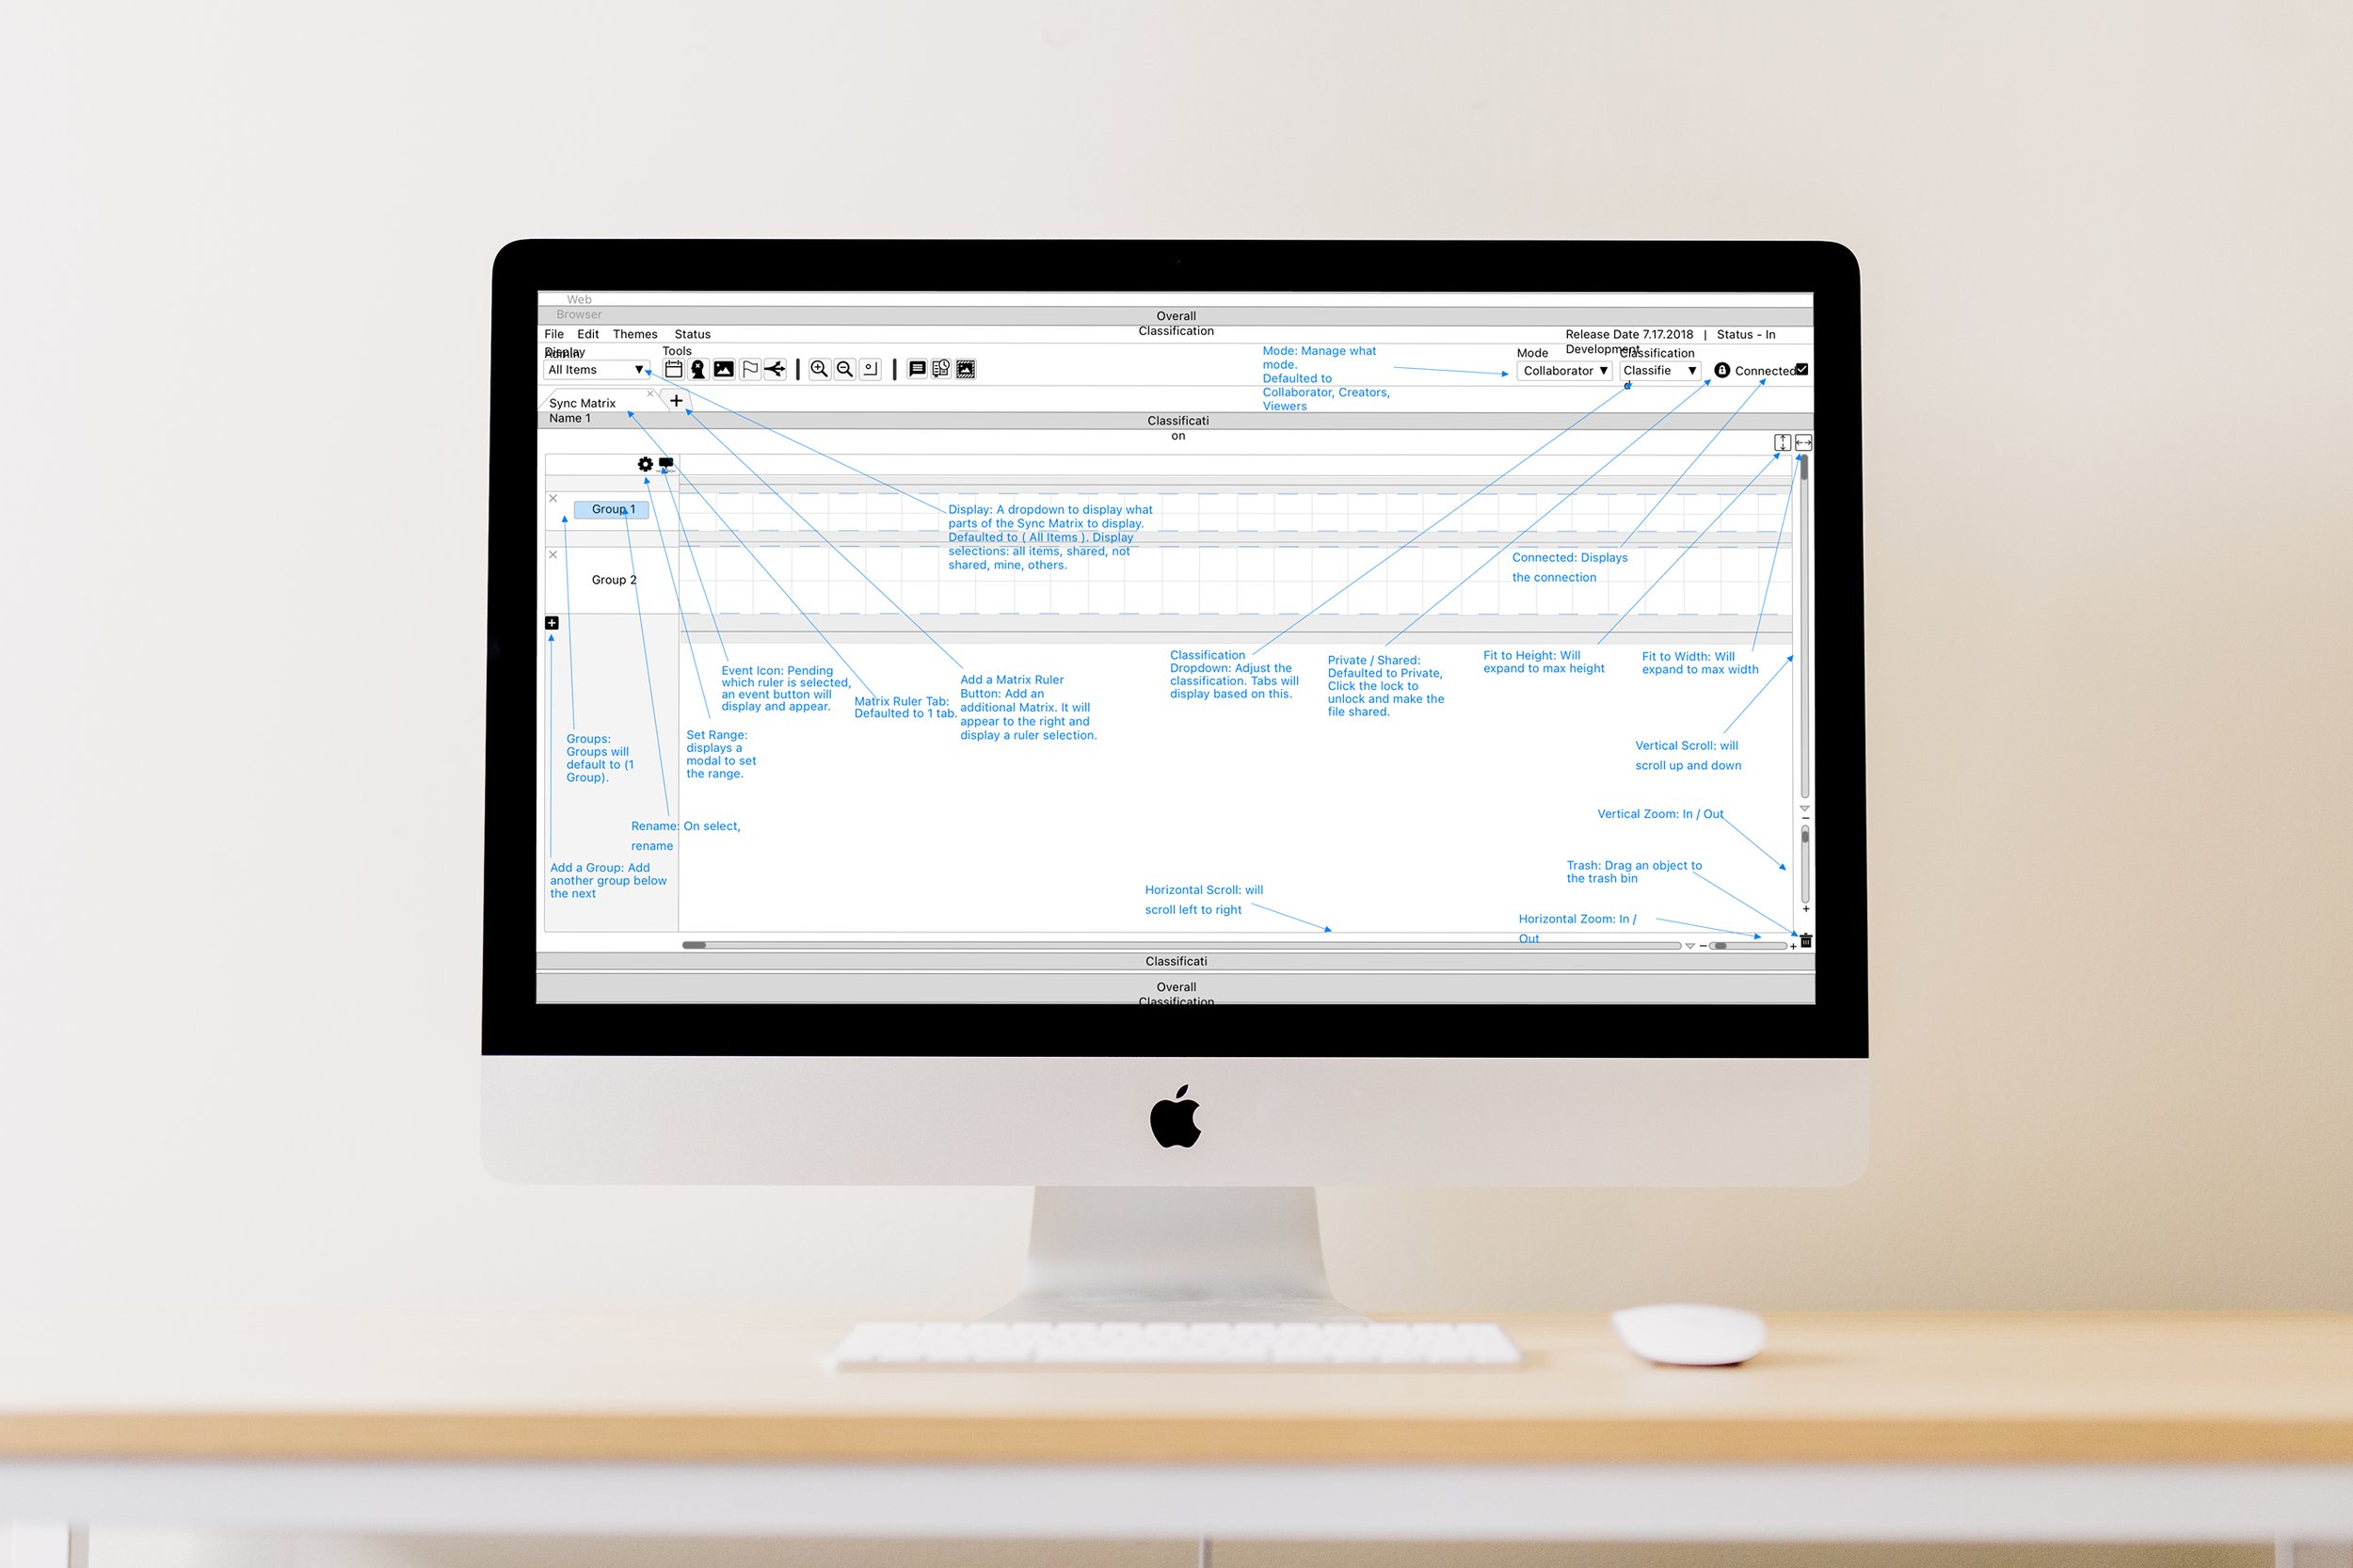
Tool Chart Annotations
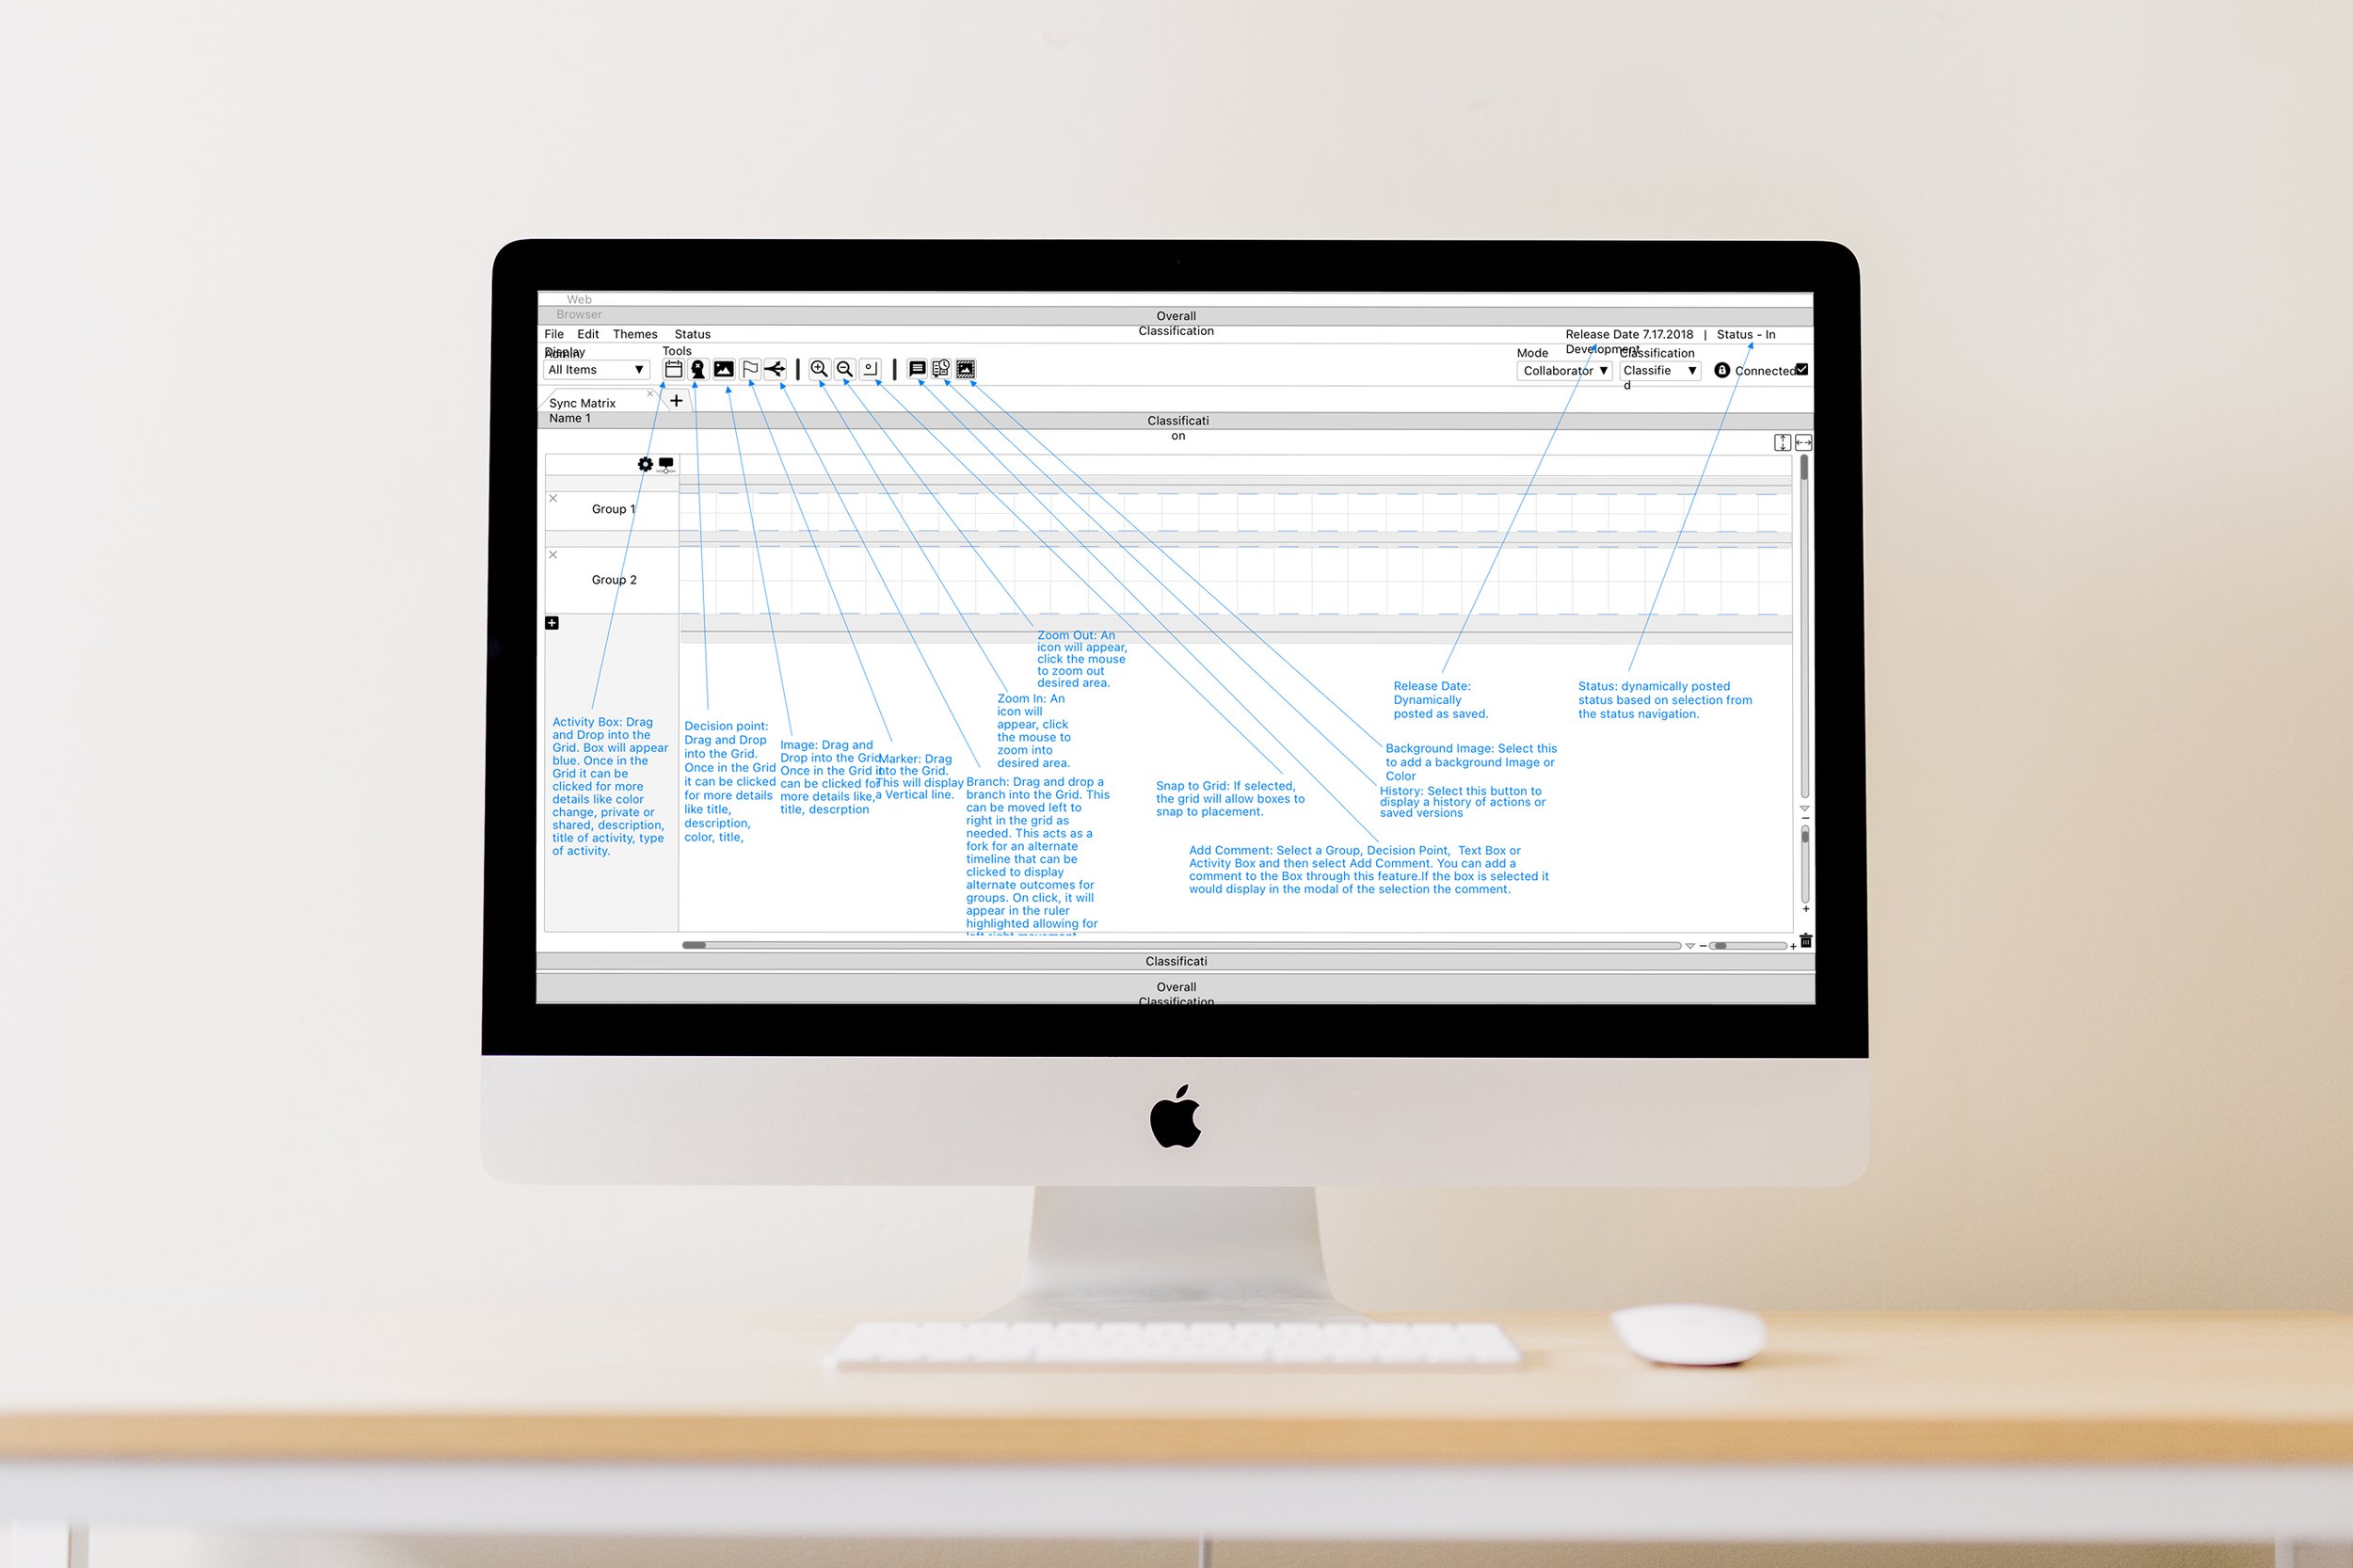
Tool Chart Annotations 2
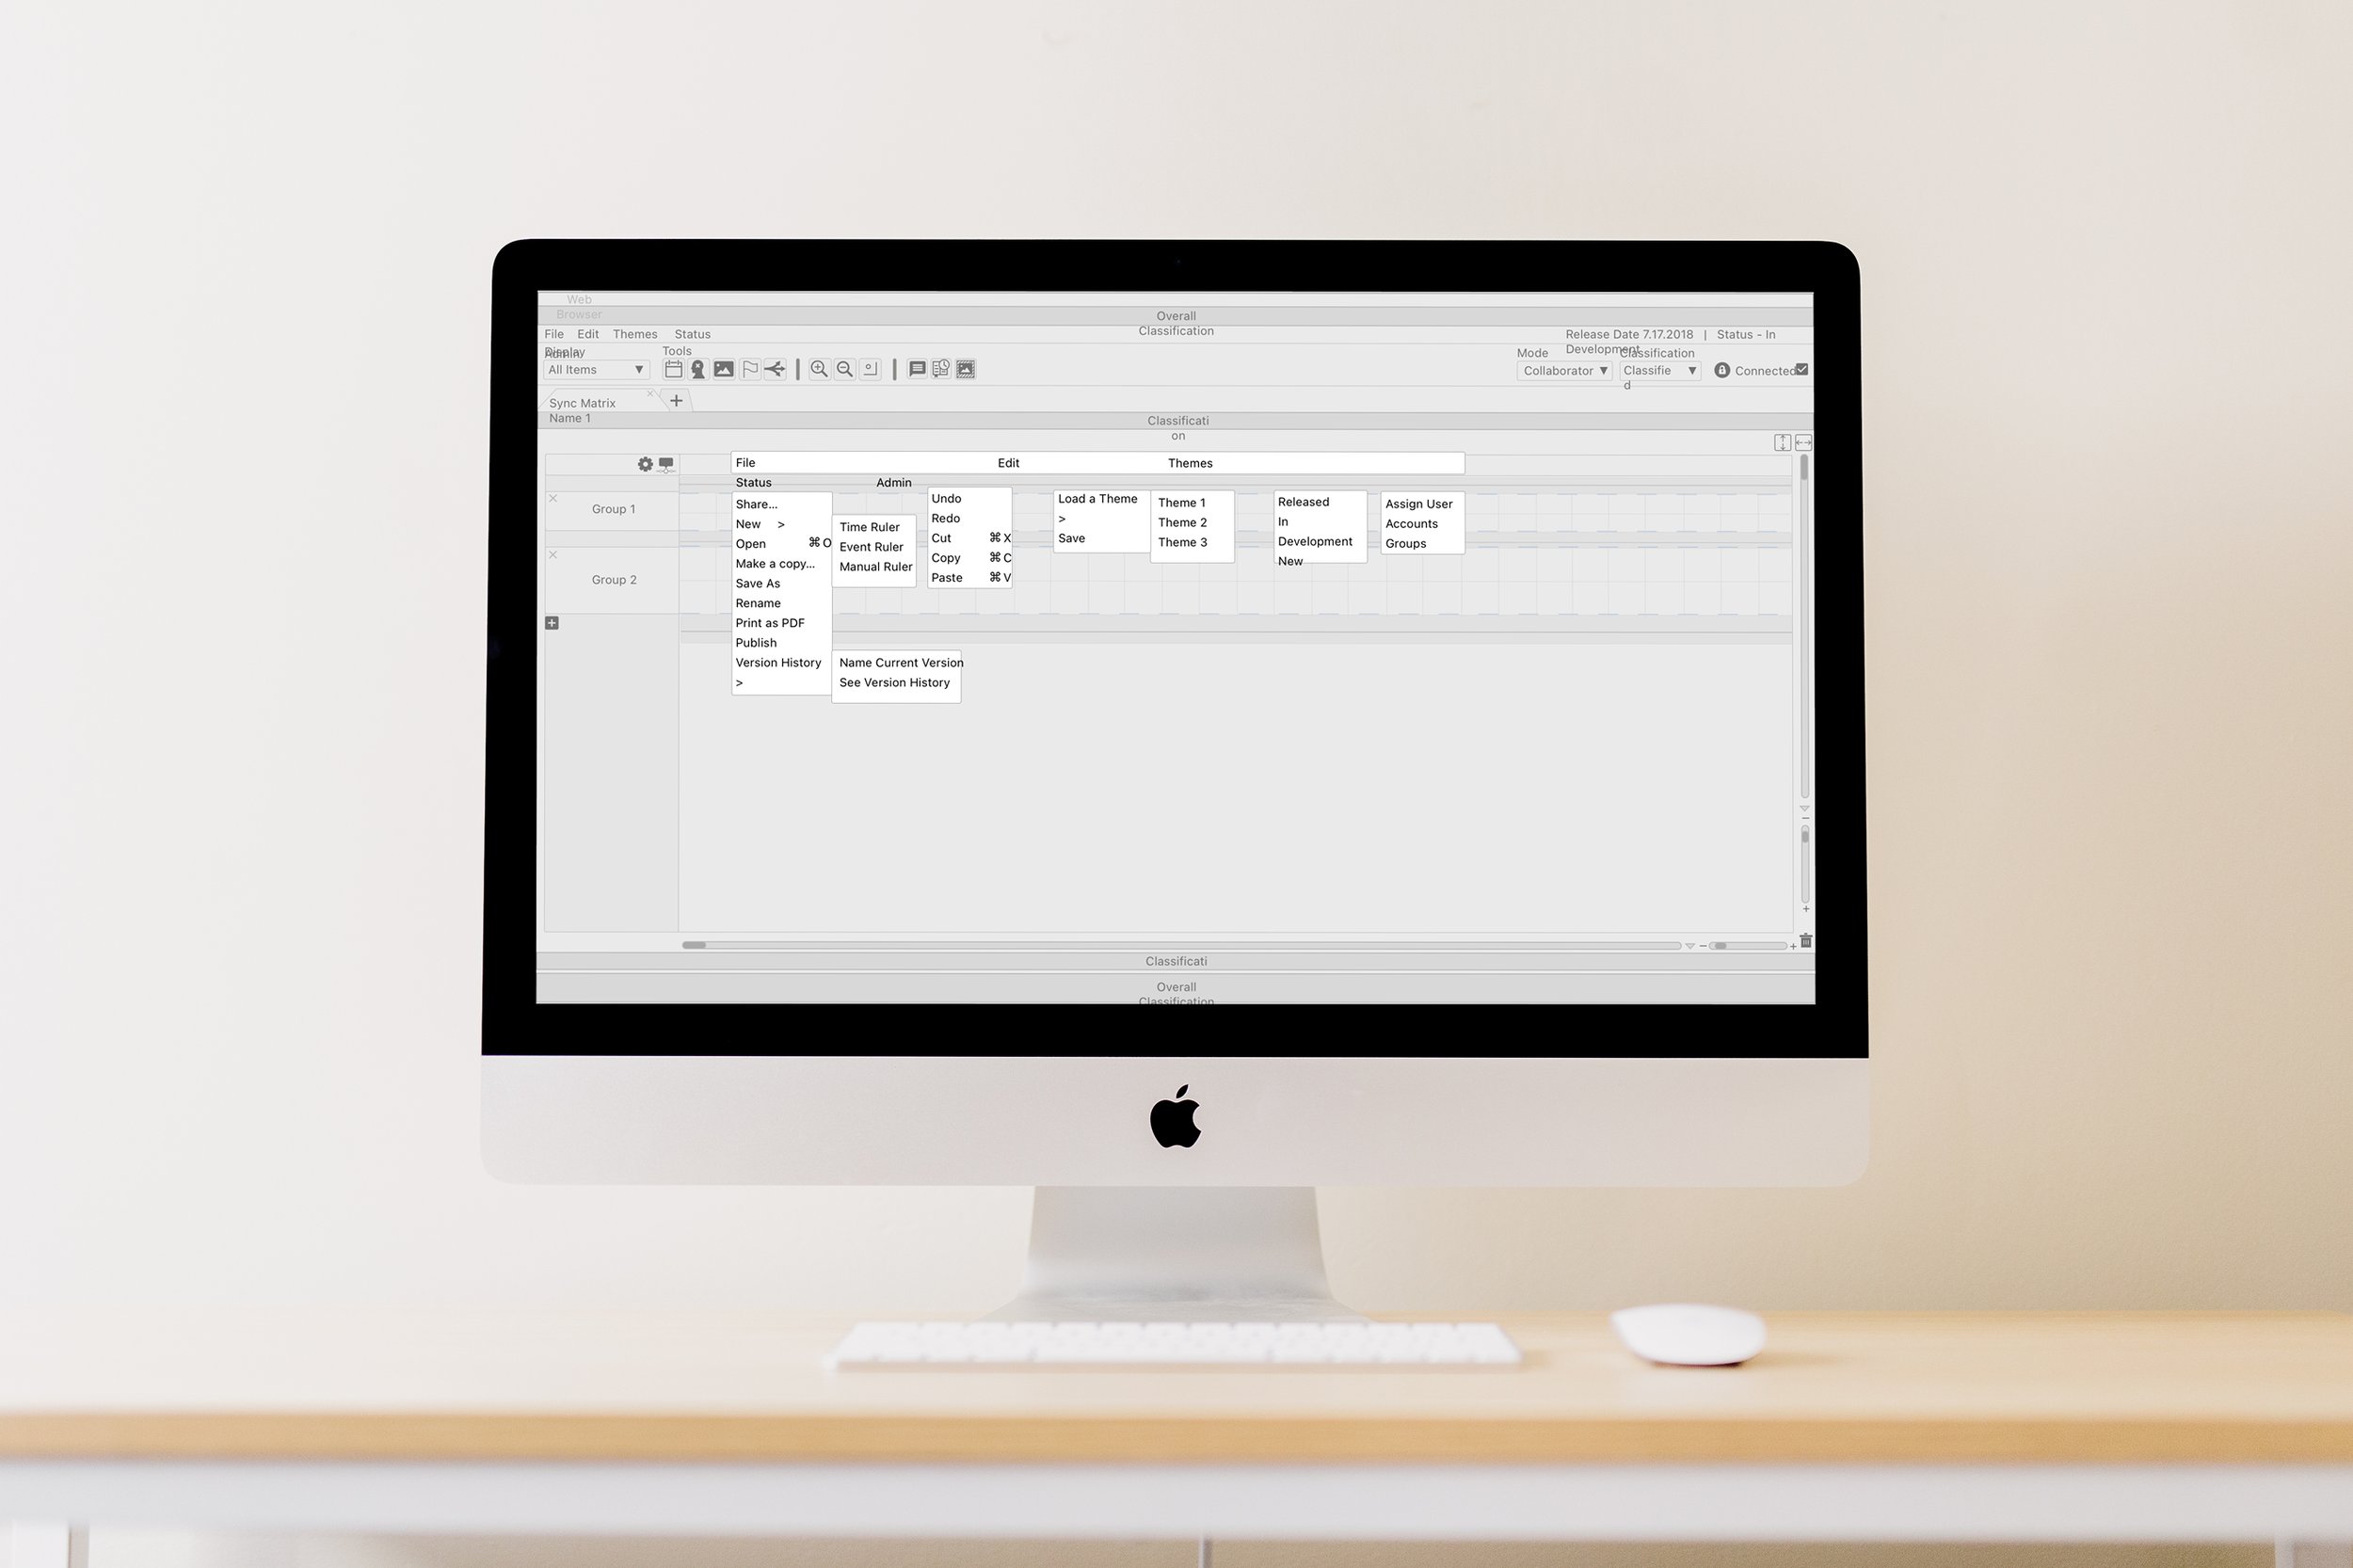
Top Navigation
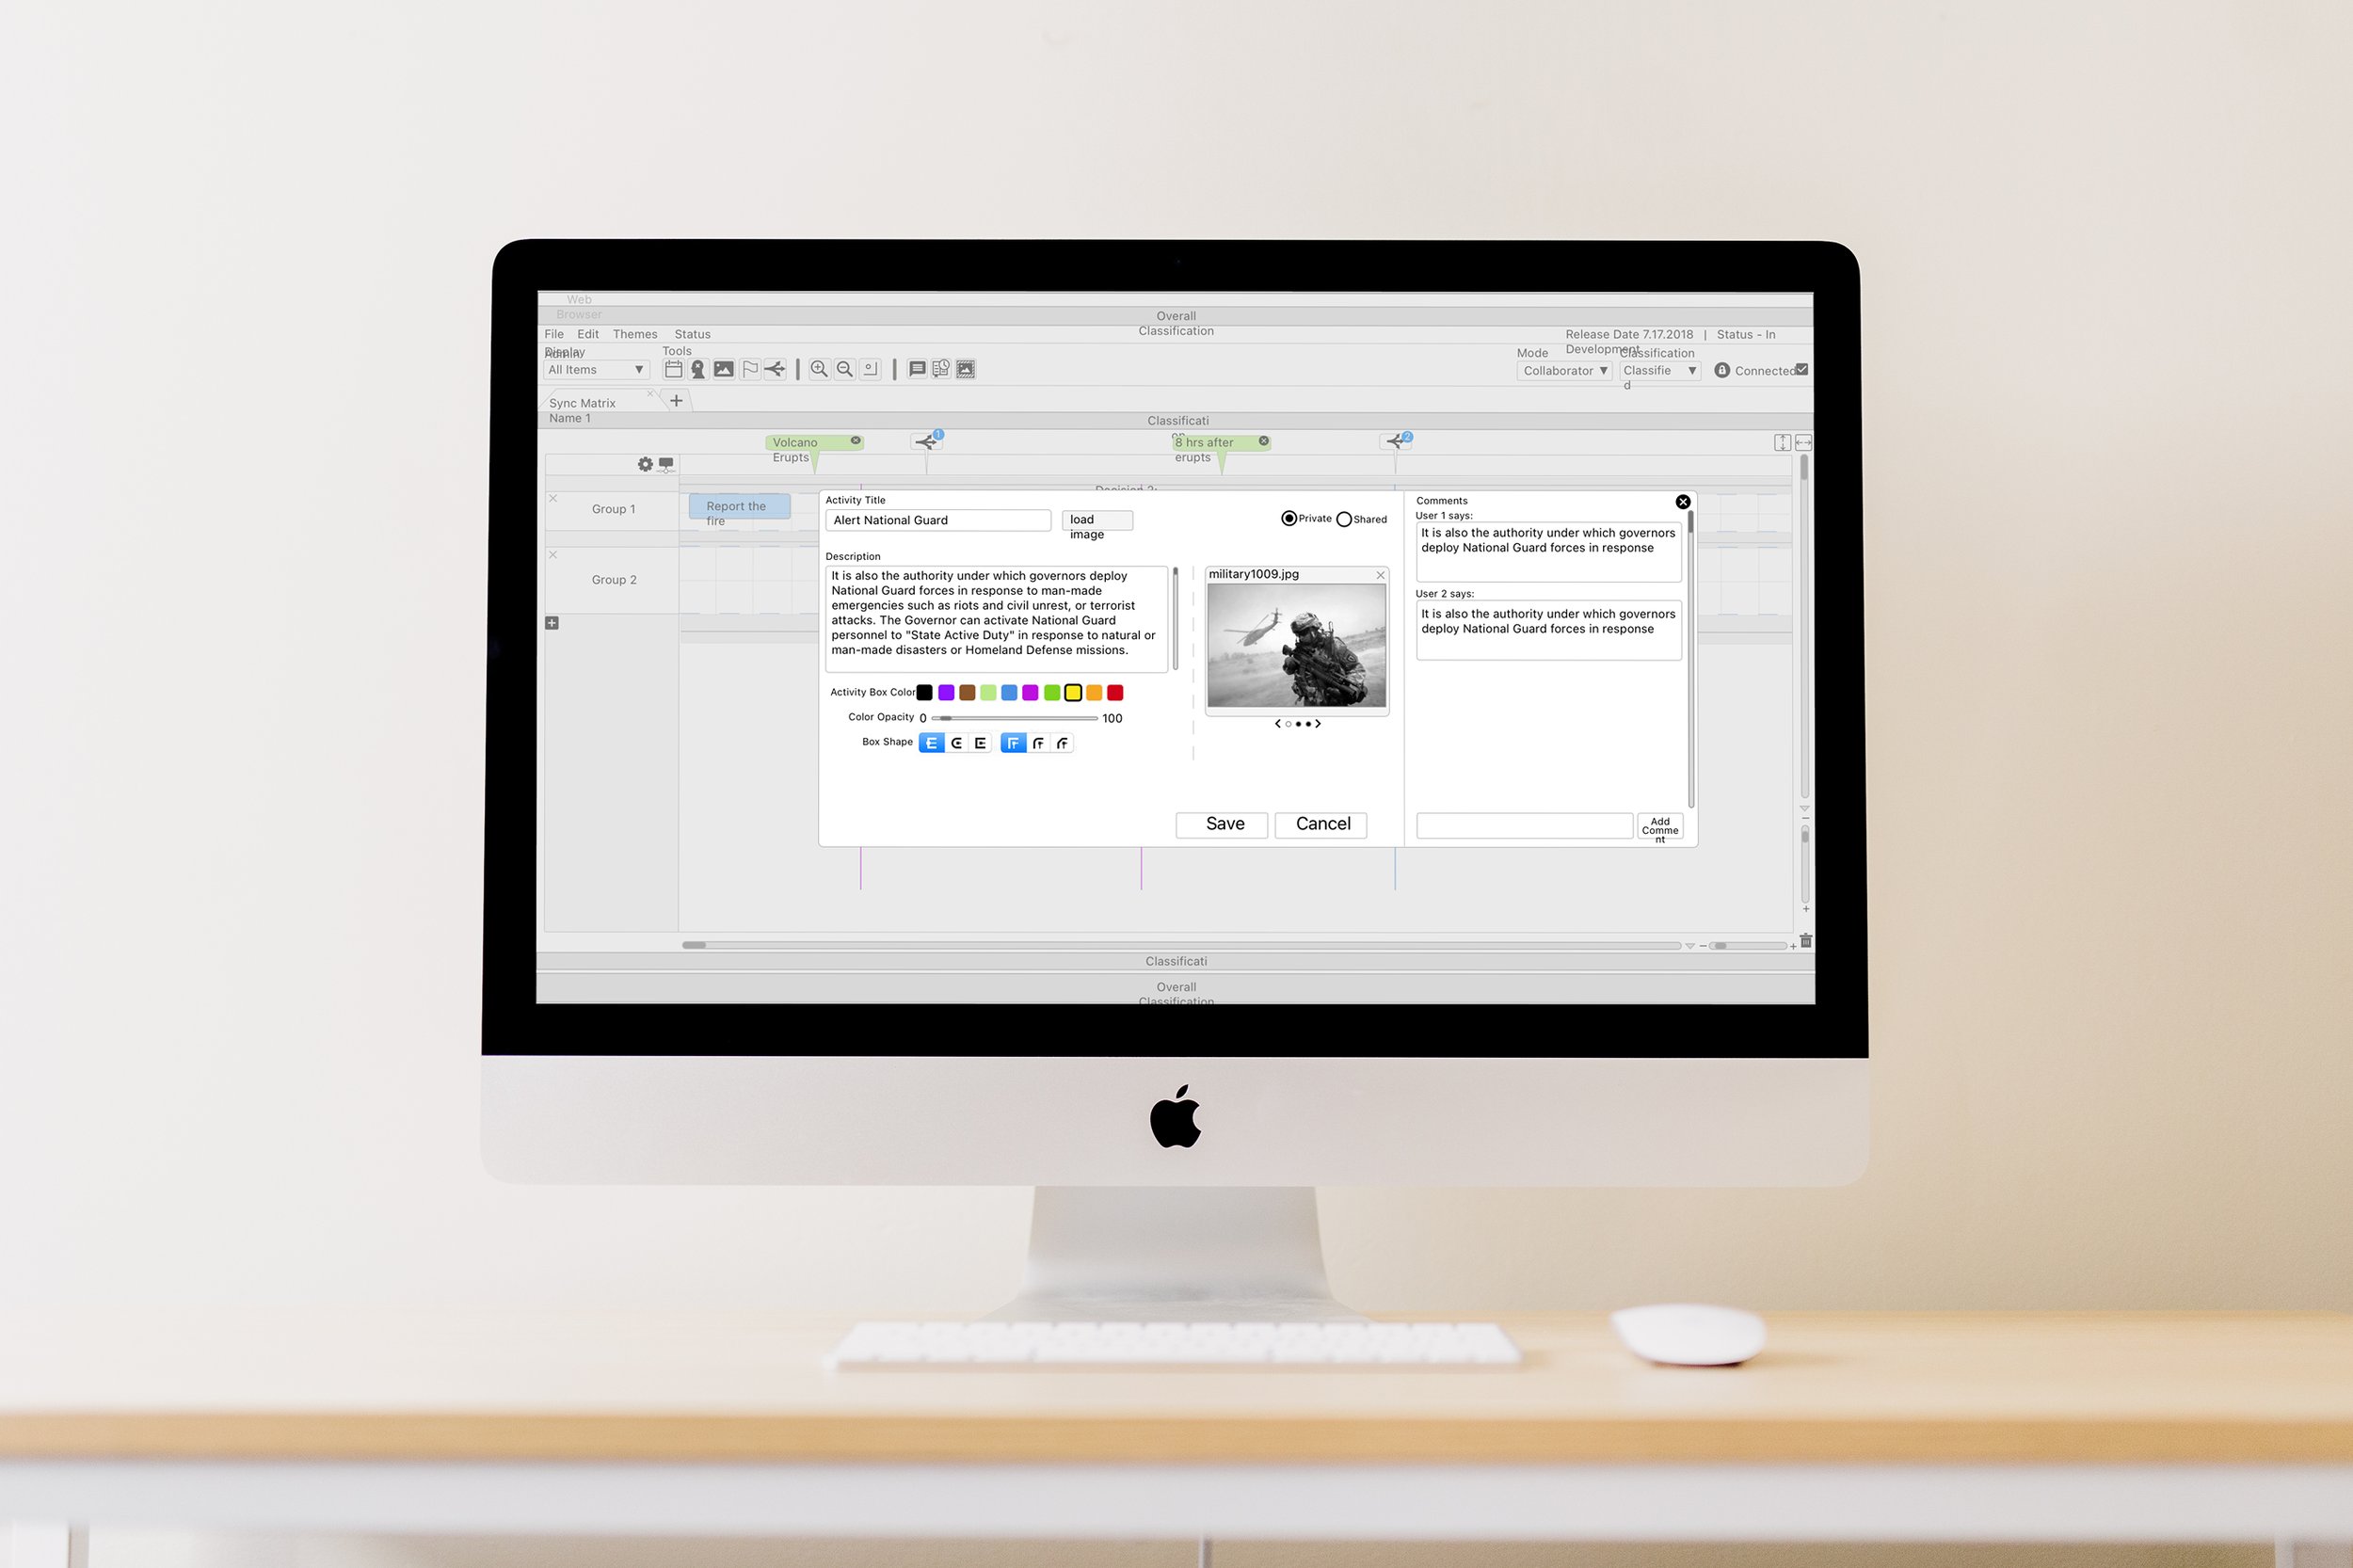
Pop Up - Add a Crisis
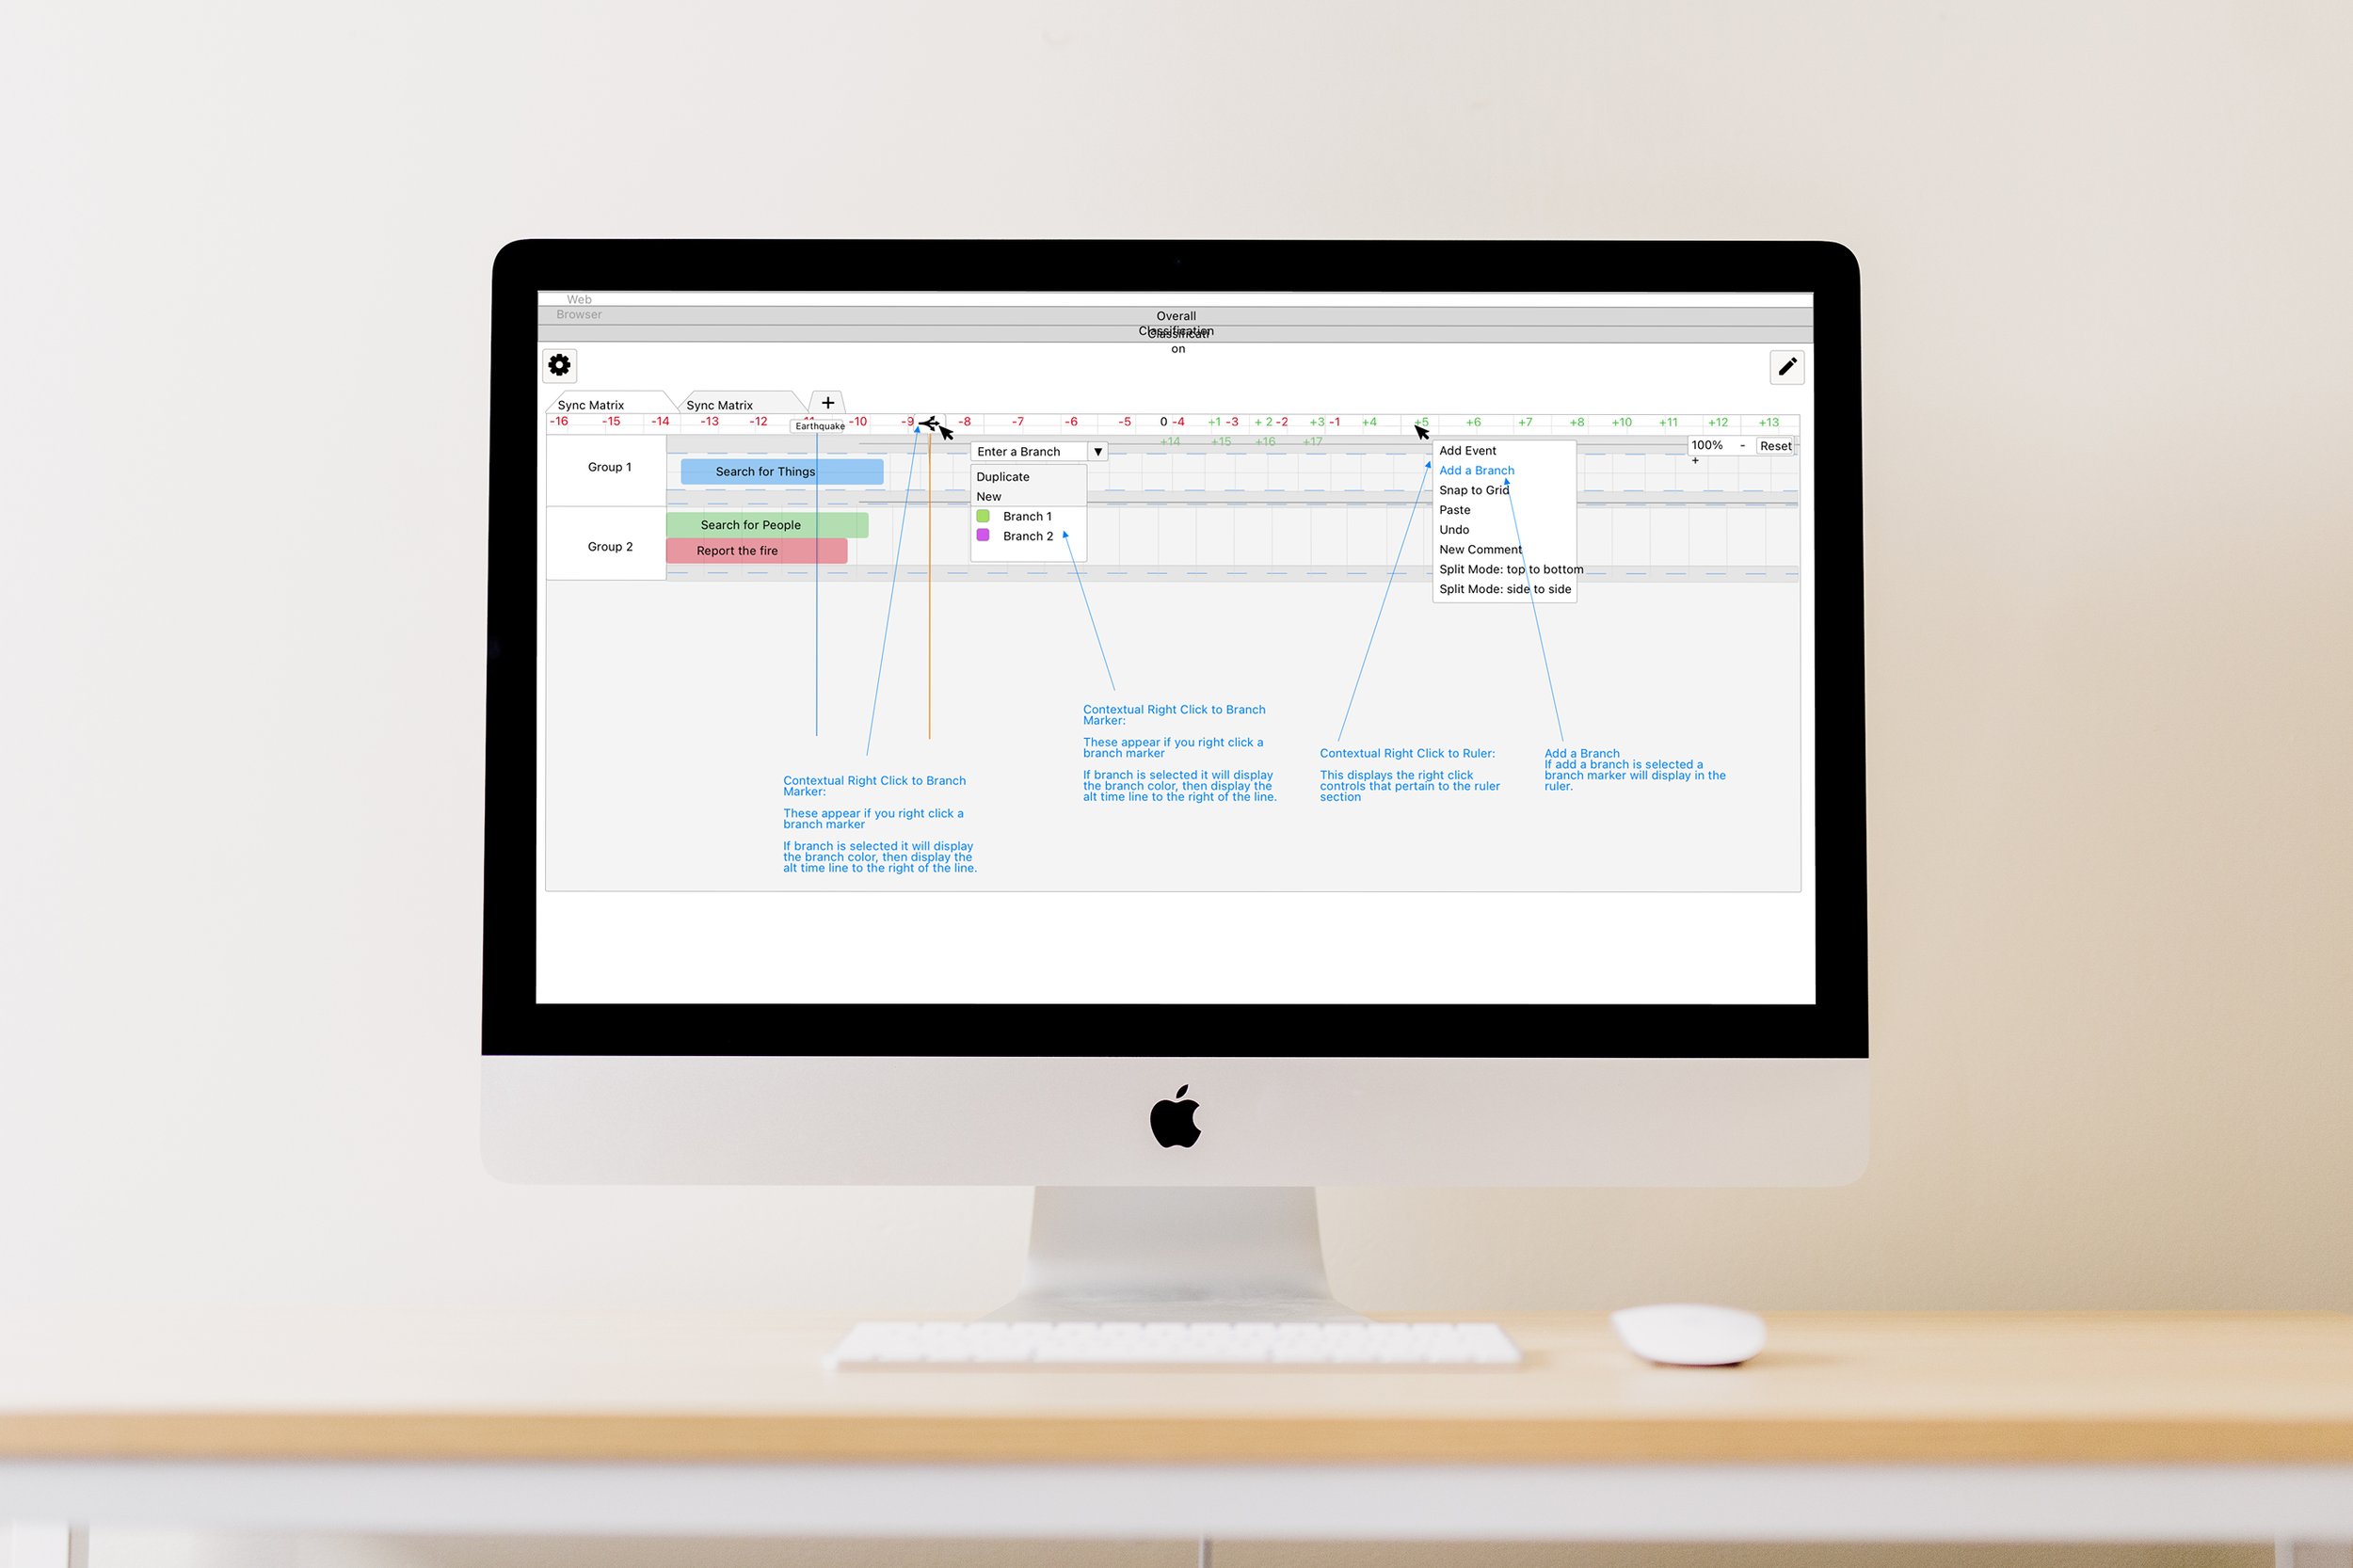
Adding A branch
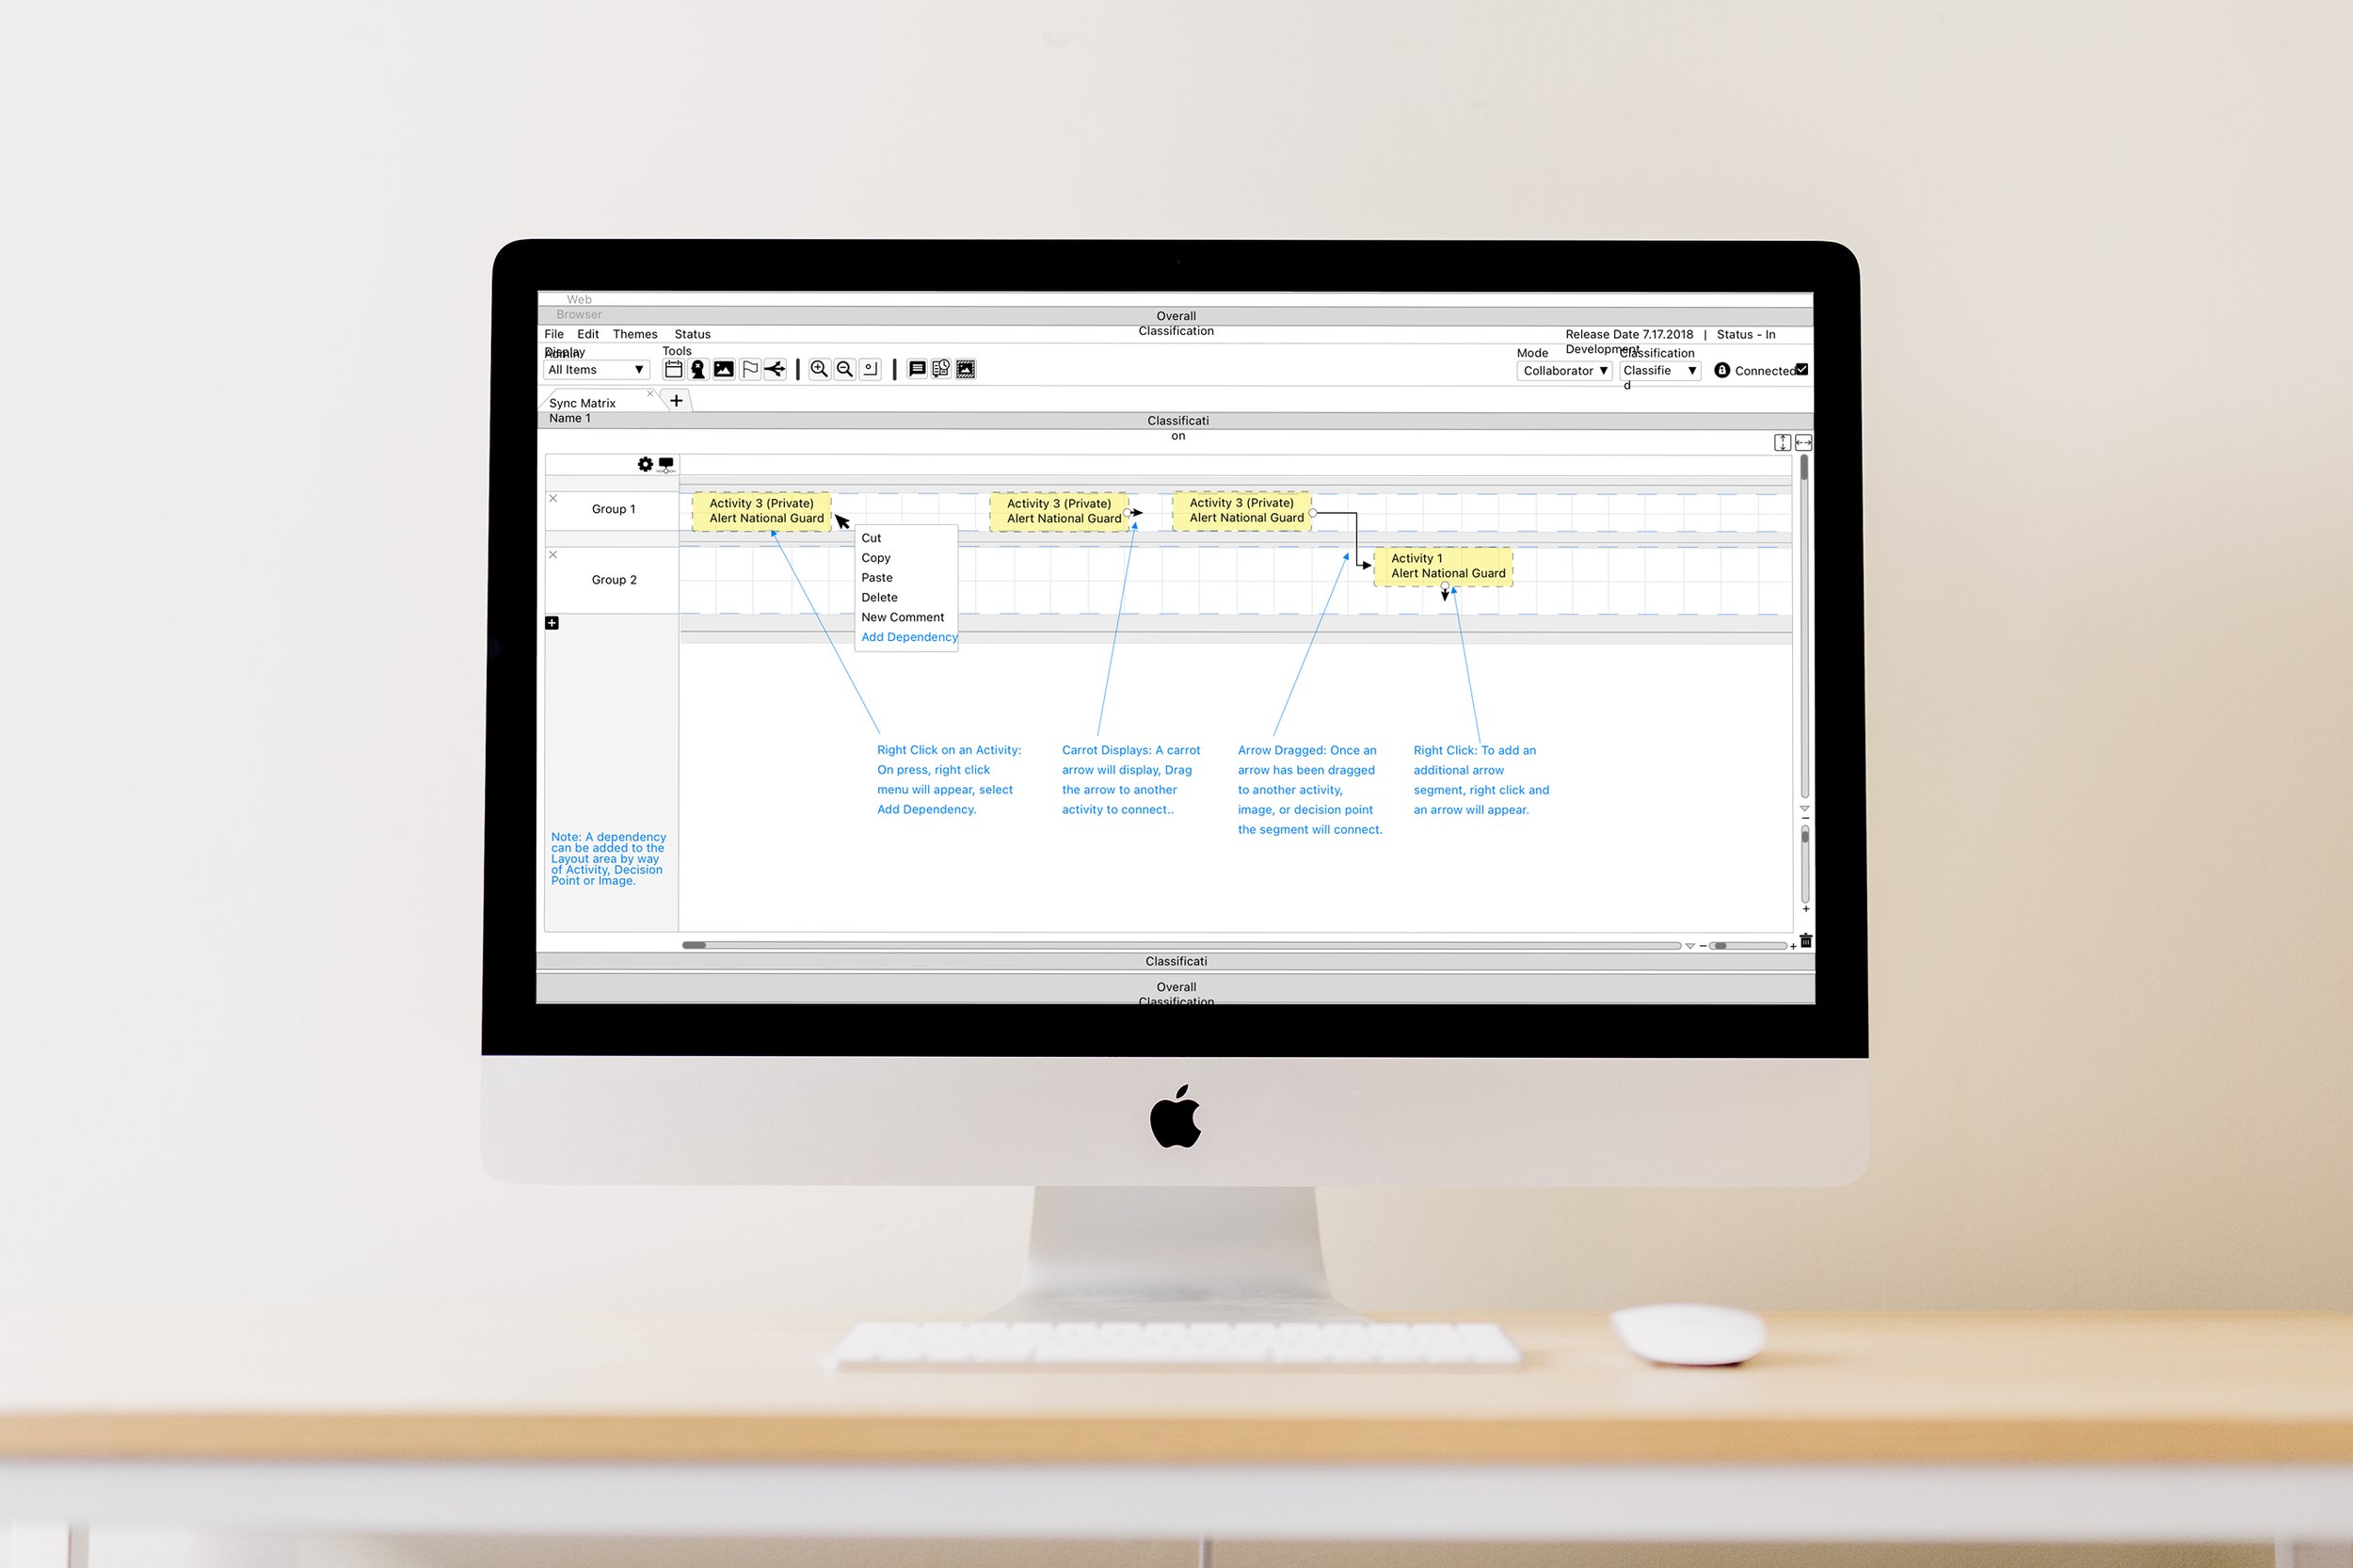
Adding a Dependancy
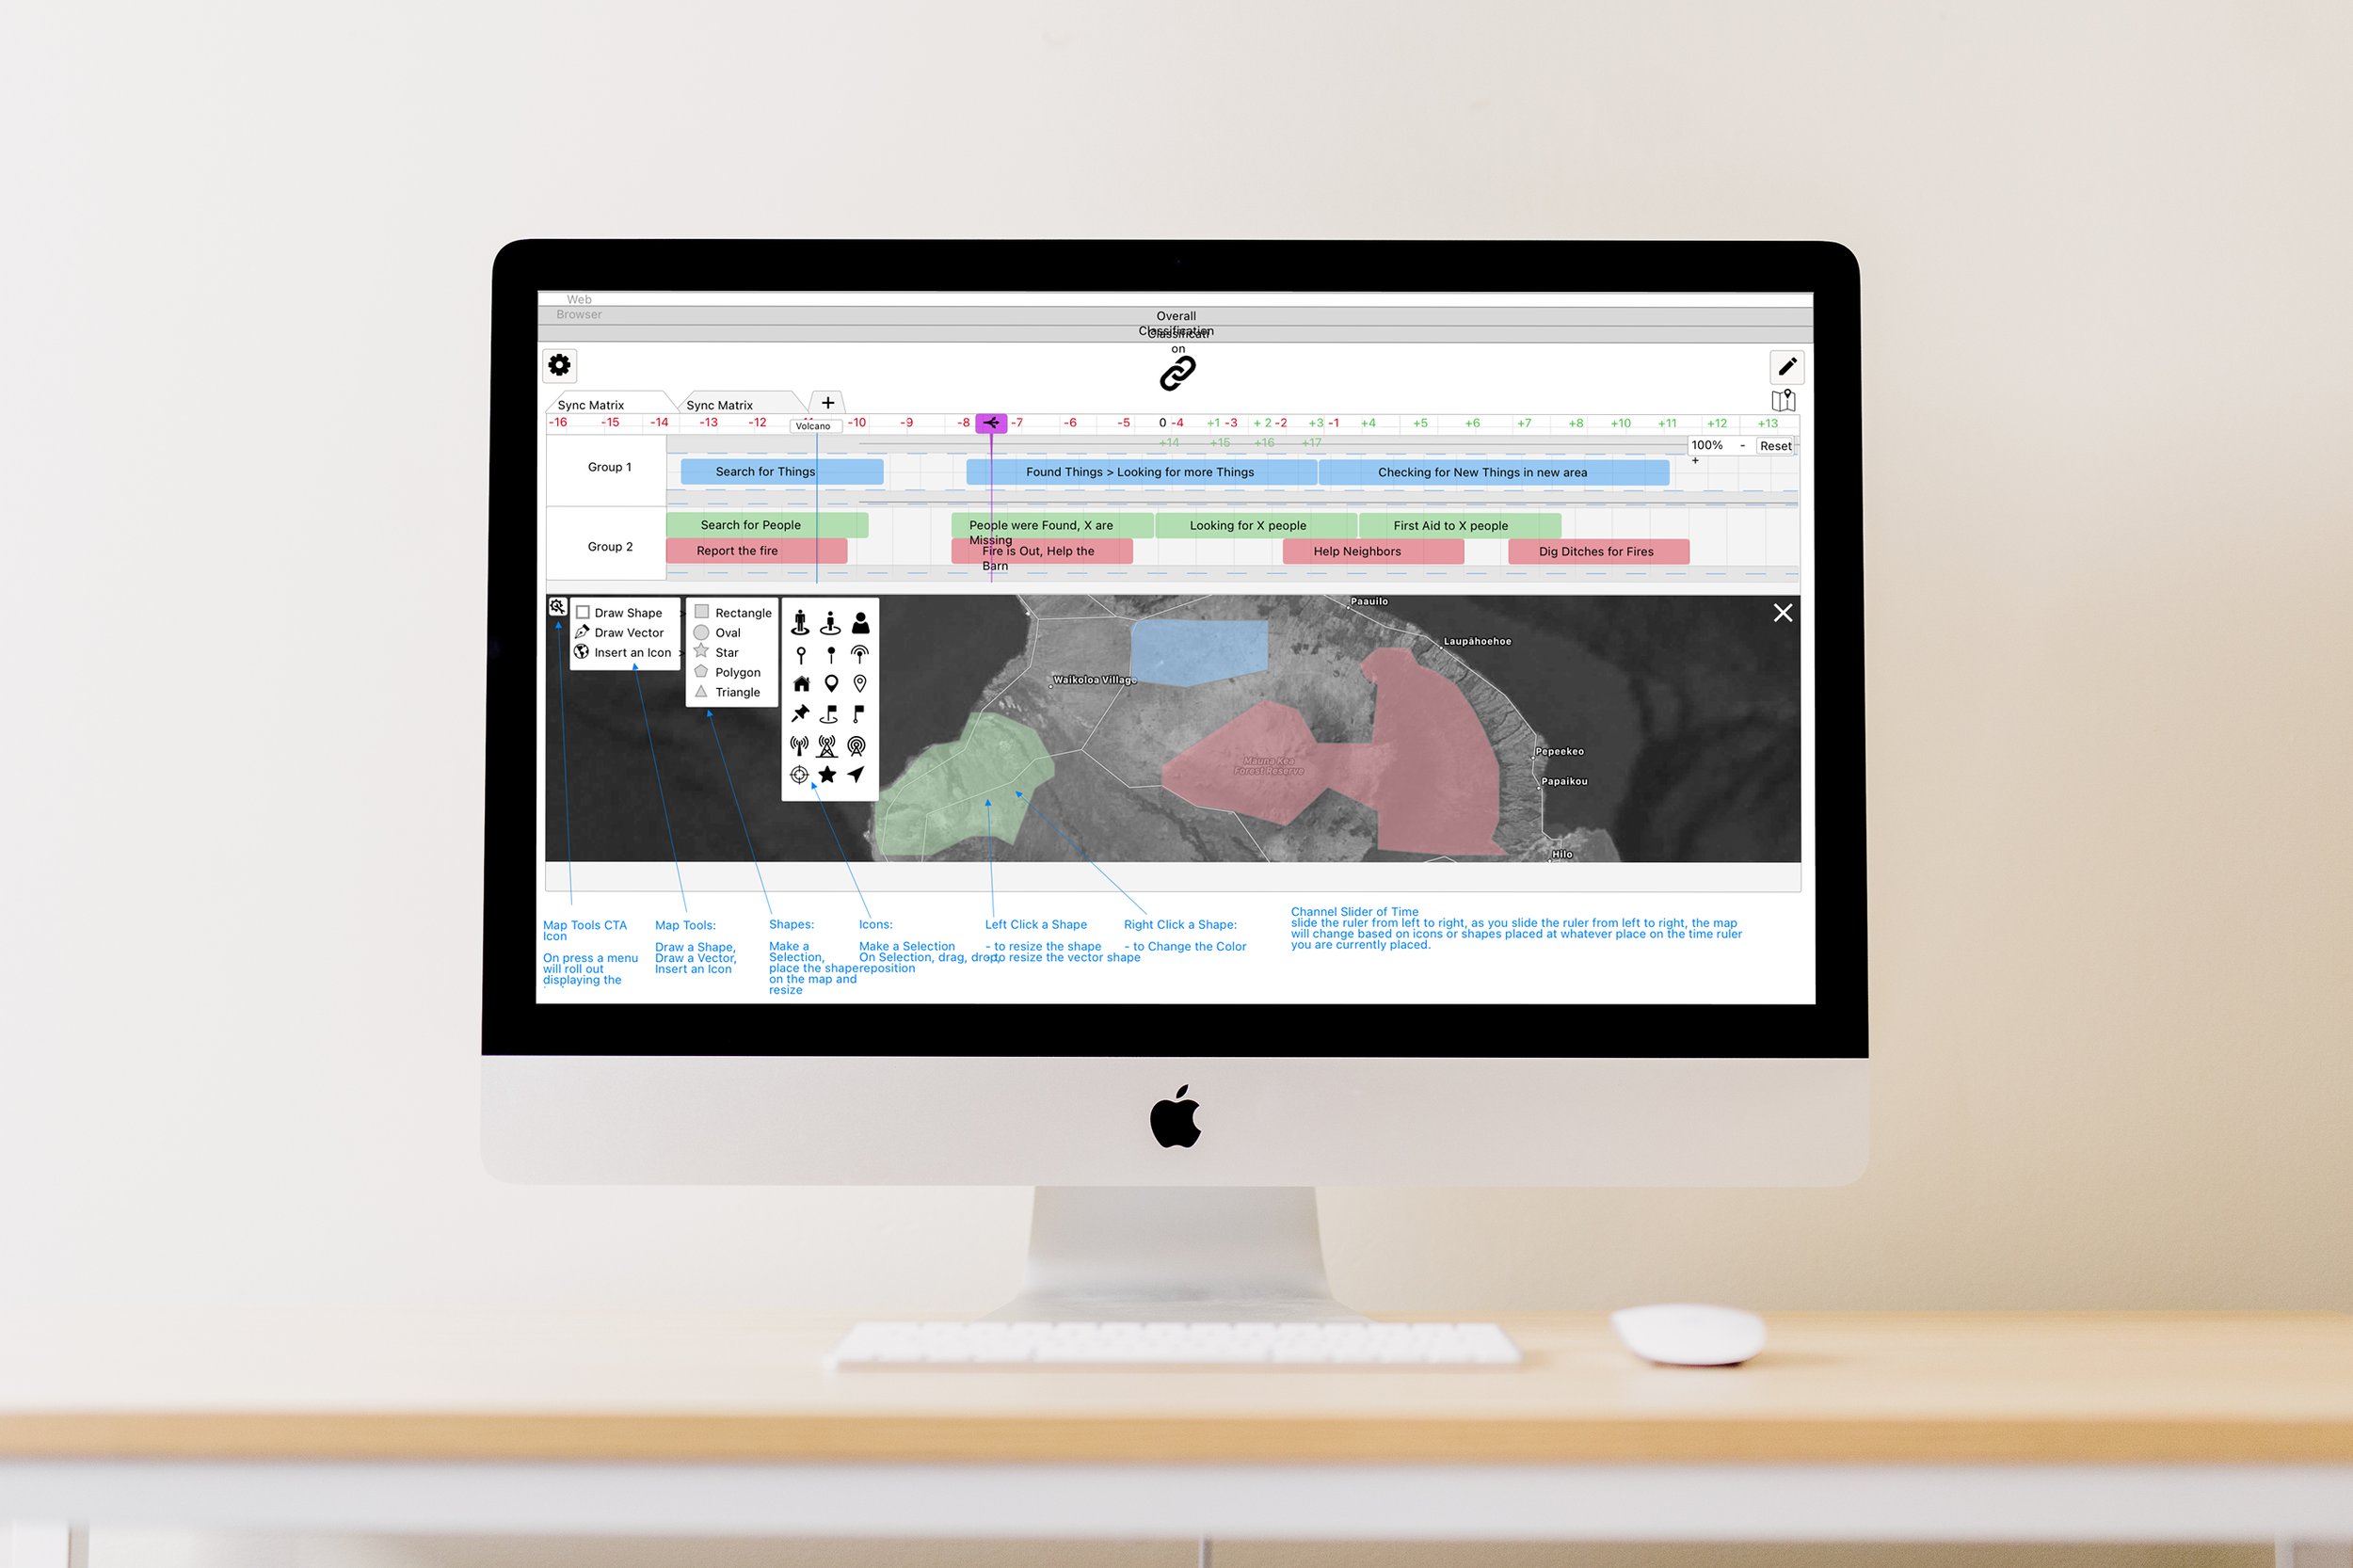
Split View with Map
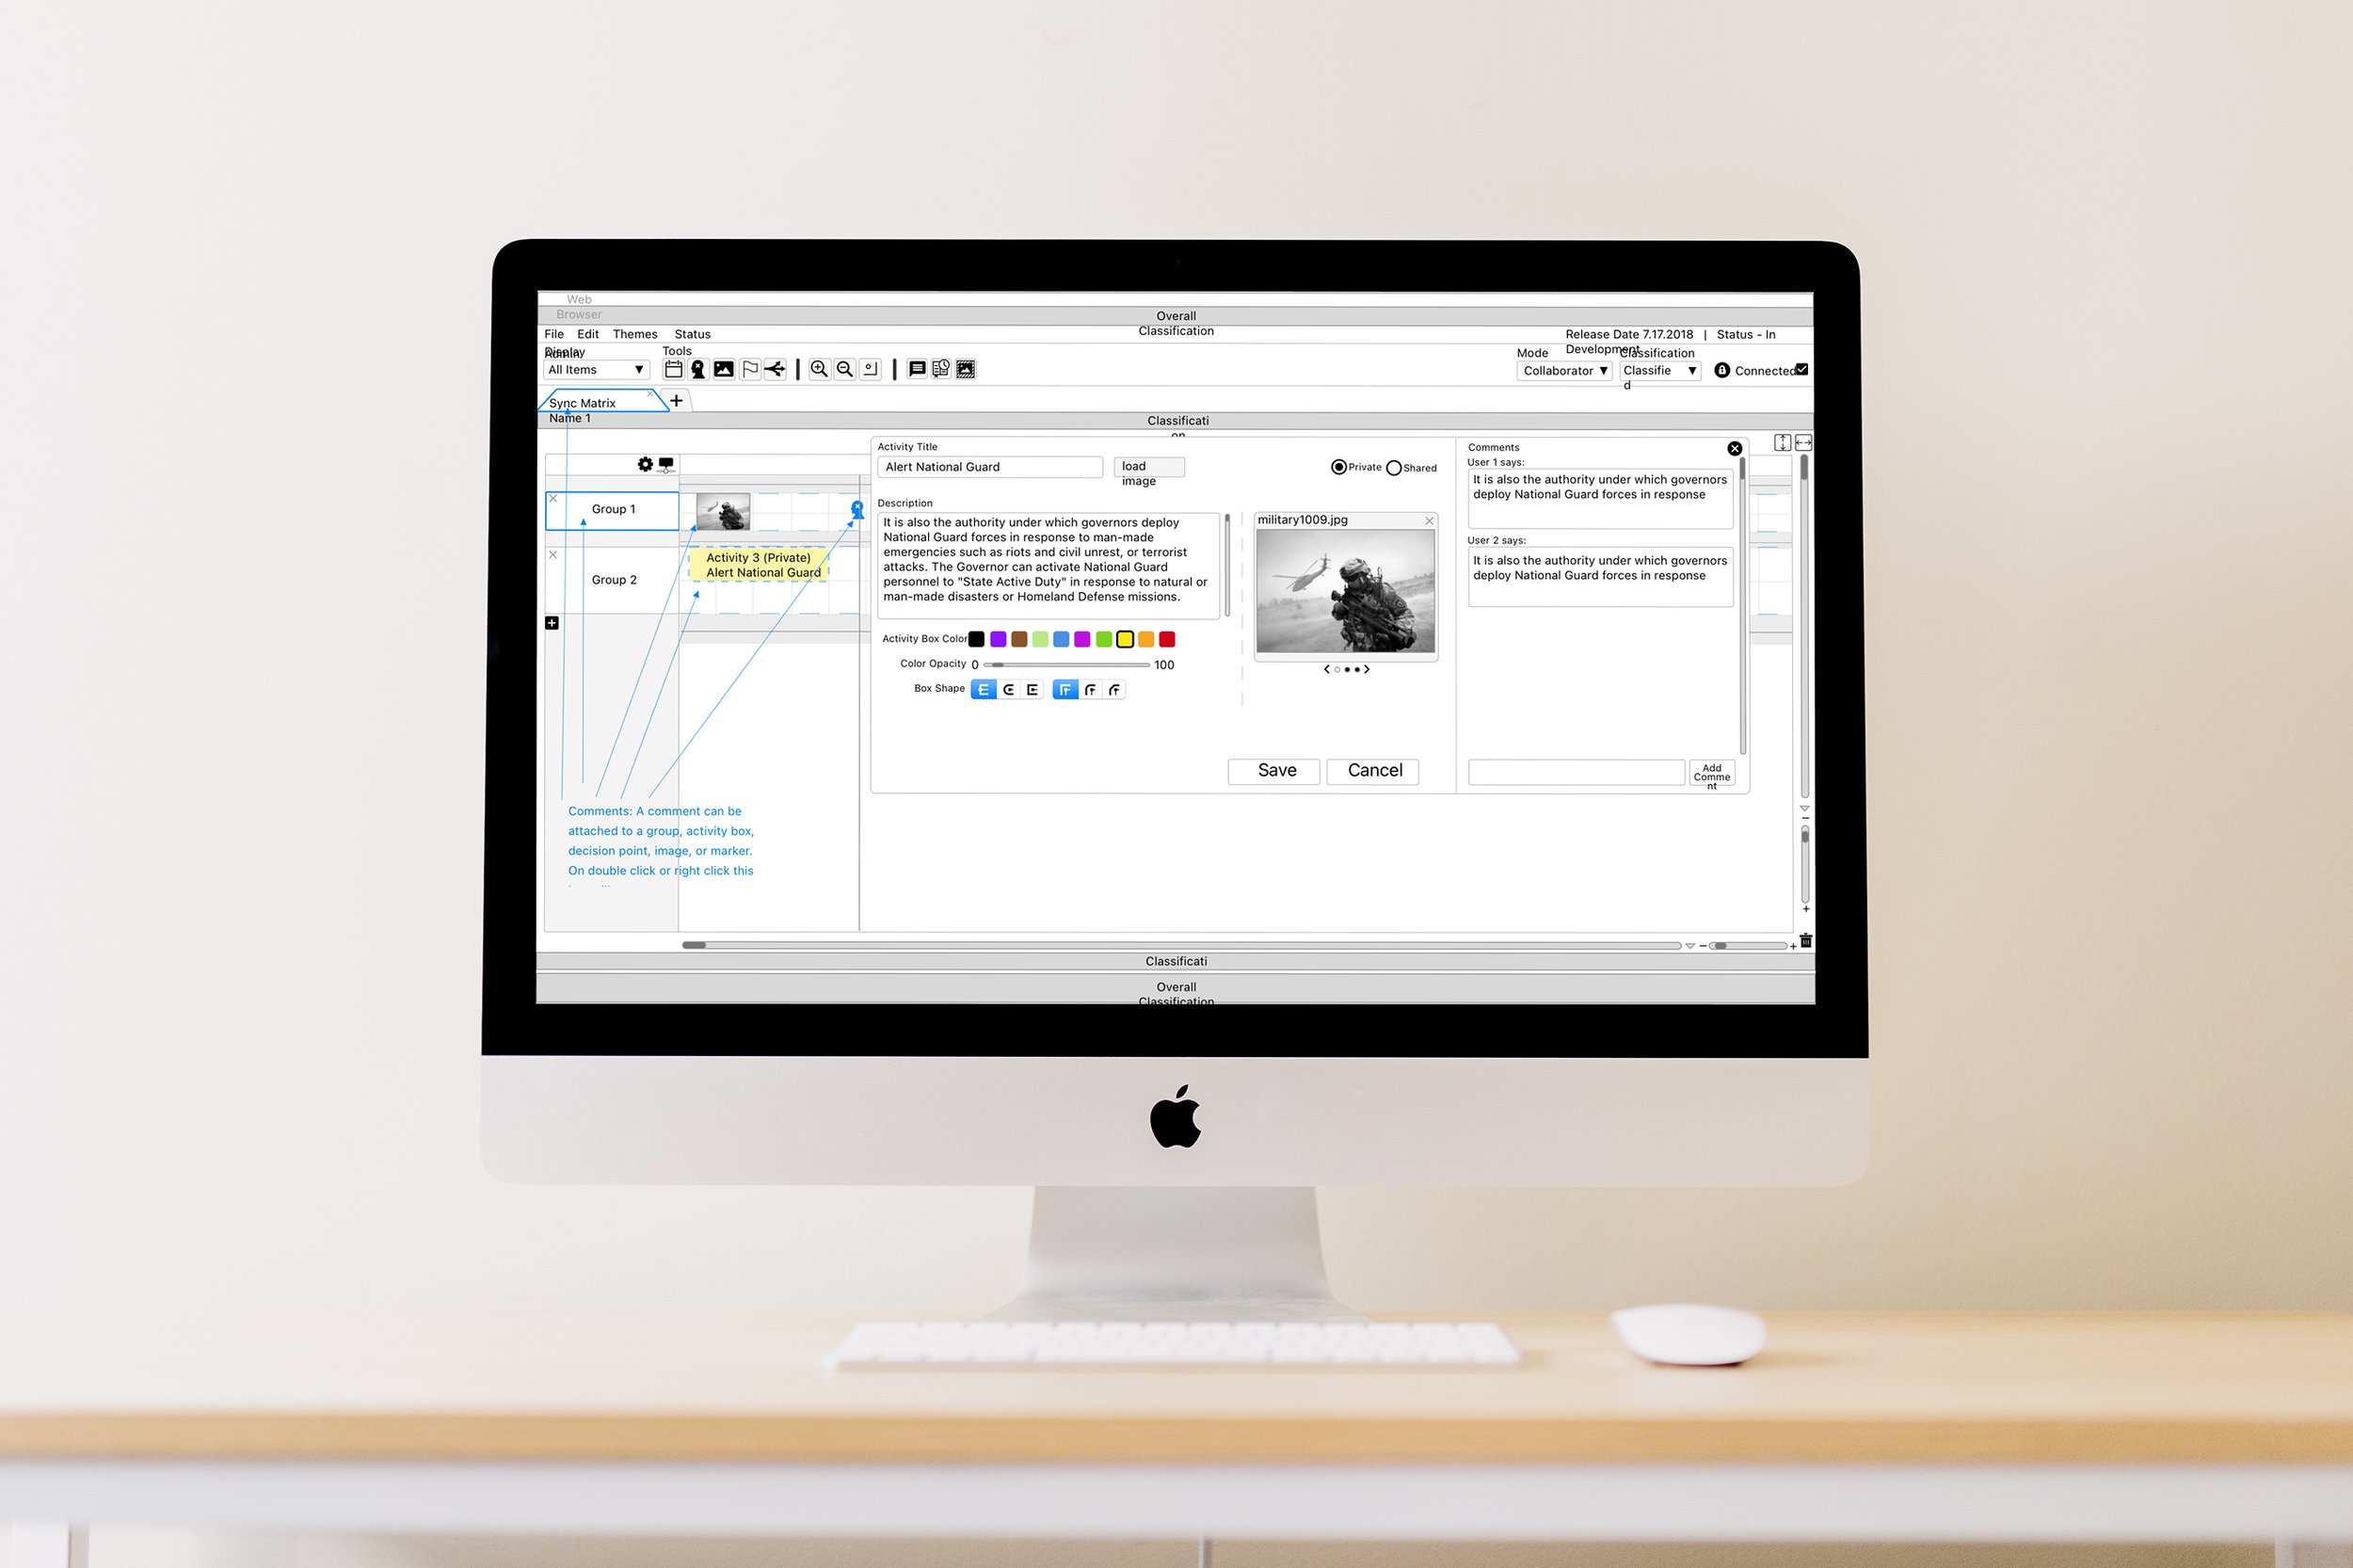
Adding a comment
04
Delivery & outcomes
A Unified UX System Supporting Multi-year Programs
Complete Spec Packages — Delivered full workflows, interaction rules, and screen systems for all three tools.
Visualization Standards — Created reusable patterns for charts, geospatial controls, multi-feed layouts, and sentiment displays.
Engineering-Ready Assets — Provided annotated design files, responsive layouts, and screen logic for development teams.
Program Expansion — Quality of the UX work contributed to extensions and new initiatives with defense and aerospace partners.
