

📌 Project: Defense, Aerospace & Data Visualization Tools
👤 Role: Sr. Lead Product Designer · Ideation & Discovery Specialist
🏢 Company: Zoic Labs (Creative technology firm at the intersection of design, data, and defense)
📆 Timeline: Dec 2017 – Feb 2019
⚡ Focus: Aerospace · Defense · Data Visualization · Web3 Experimentation
🛠 Services: UI · UX · User Research · Ideation · Discovery Pitches
🎯 Impact: Delivered UX design for mission-critical defense and aerospace applications, including a Military Classification UI, Crisis Response platform, EMF Frequency Tracker, and an Orbital Trajectory Space Debris tool. Partnered with engineers and analysts to simplify high-volume data for intelligence workflows. Expanded innovation efforts beyond government work by designing a BTC simulator dashboard and prototyping an MR-based financial experience for Capital One.
Data Visualization: BTC Simulation - We recognized that scraping data from Twitter and other sources using Elastic-search could yield impressive visualizations on popular topics such as the presidential election or cryptocurrencies. In 2019, as Bitcoin (BTC) gained popularity, we decided to create an interactive data visualization tool. This tool would allow users to track sentiment and tone while making hypothetical trades. The UI served as the front end for displaying complex data based on social media sentiment and daily market activity. Our goal was to determine if sentiment directly influenced asset prices.


Classification Screen Sharing SaaS Tool
At ZoicLabs, my responsibility was to develop a SaaS UI designed to display a wide range of assets, including static images, live broadcast video, diagnostic tools, mapping, satellite imagery, and various metric-based visual elements.
I began the project with wireframes to provide a clear understanding of user interactions and workflows. Additionally, this tool facilitated secure military classification sharing by restricting viewer access based on security permission levels.
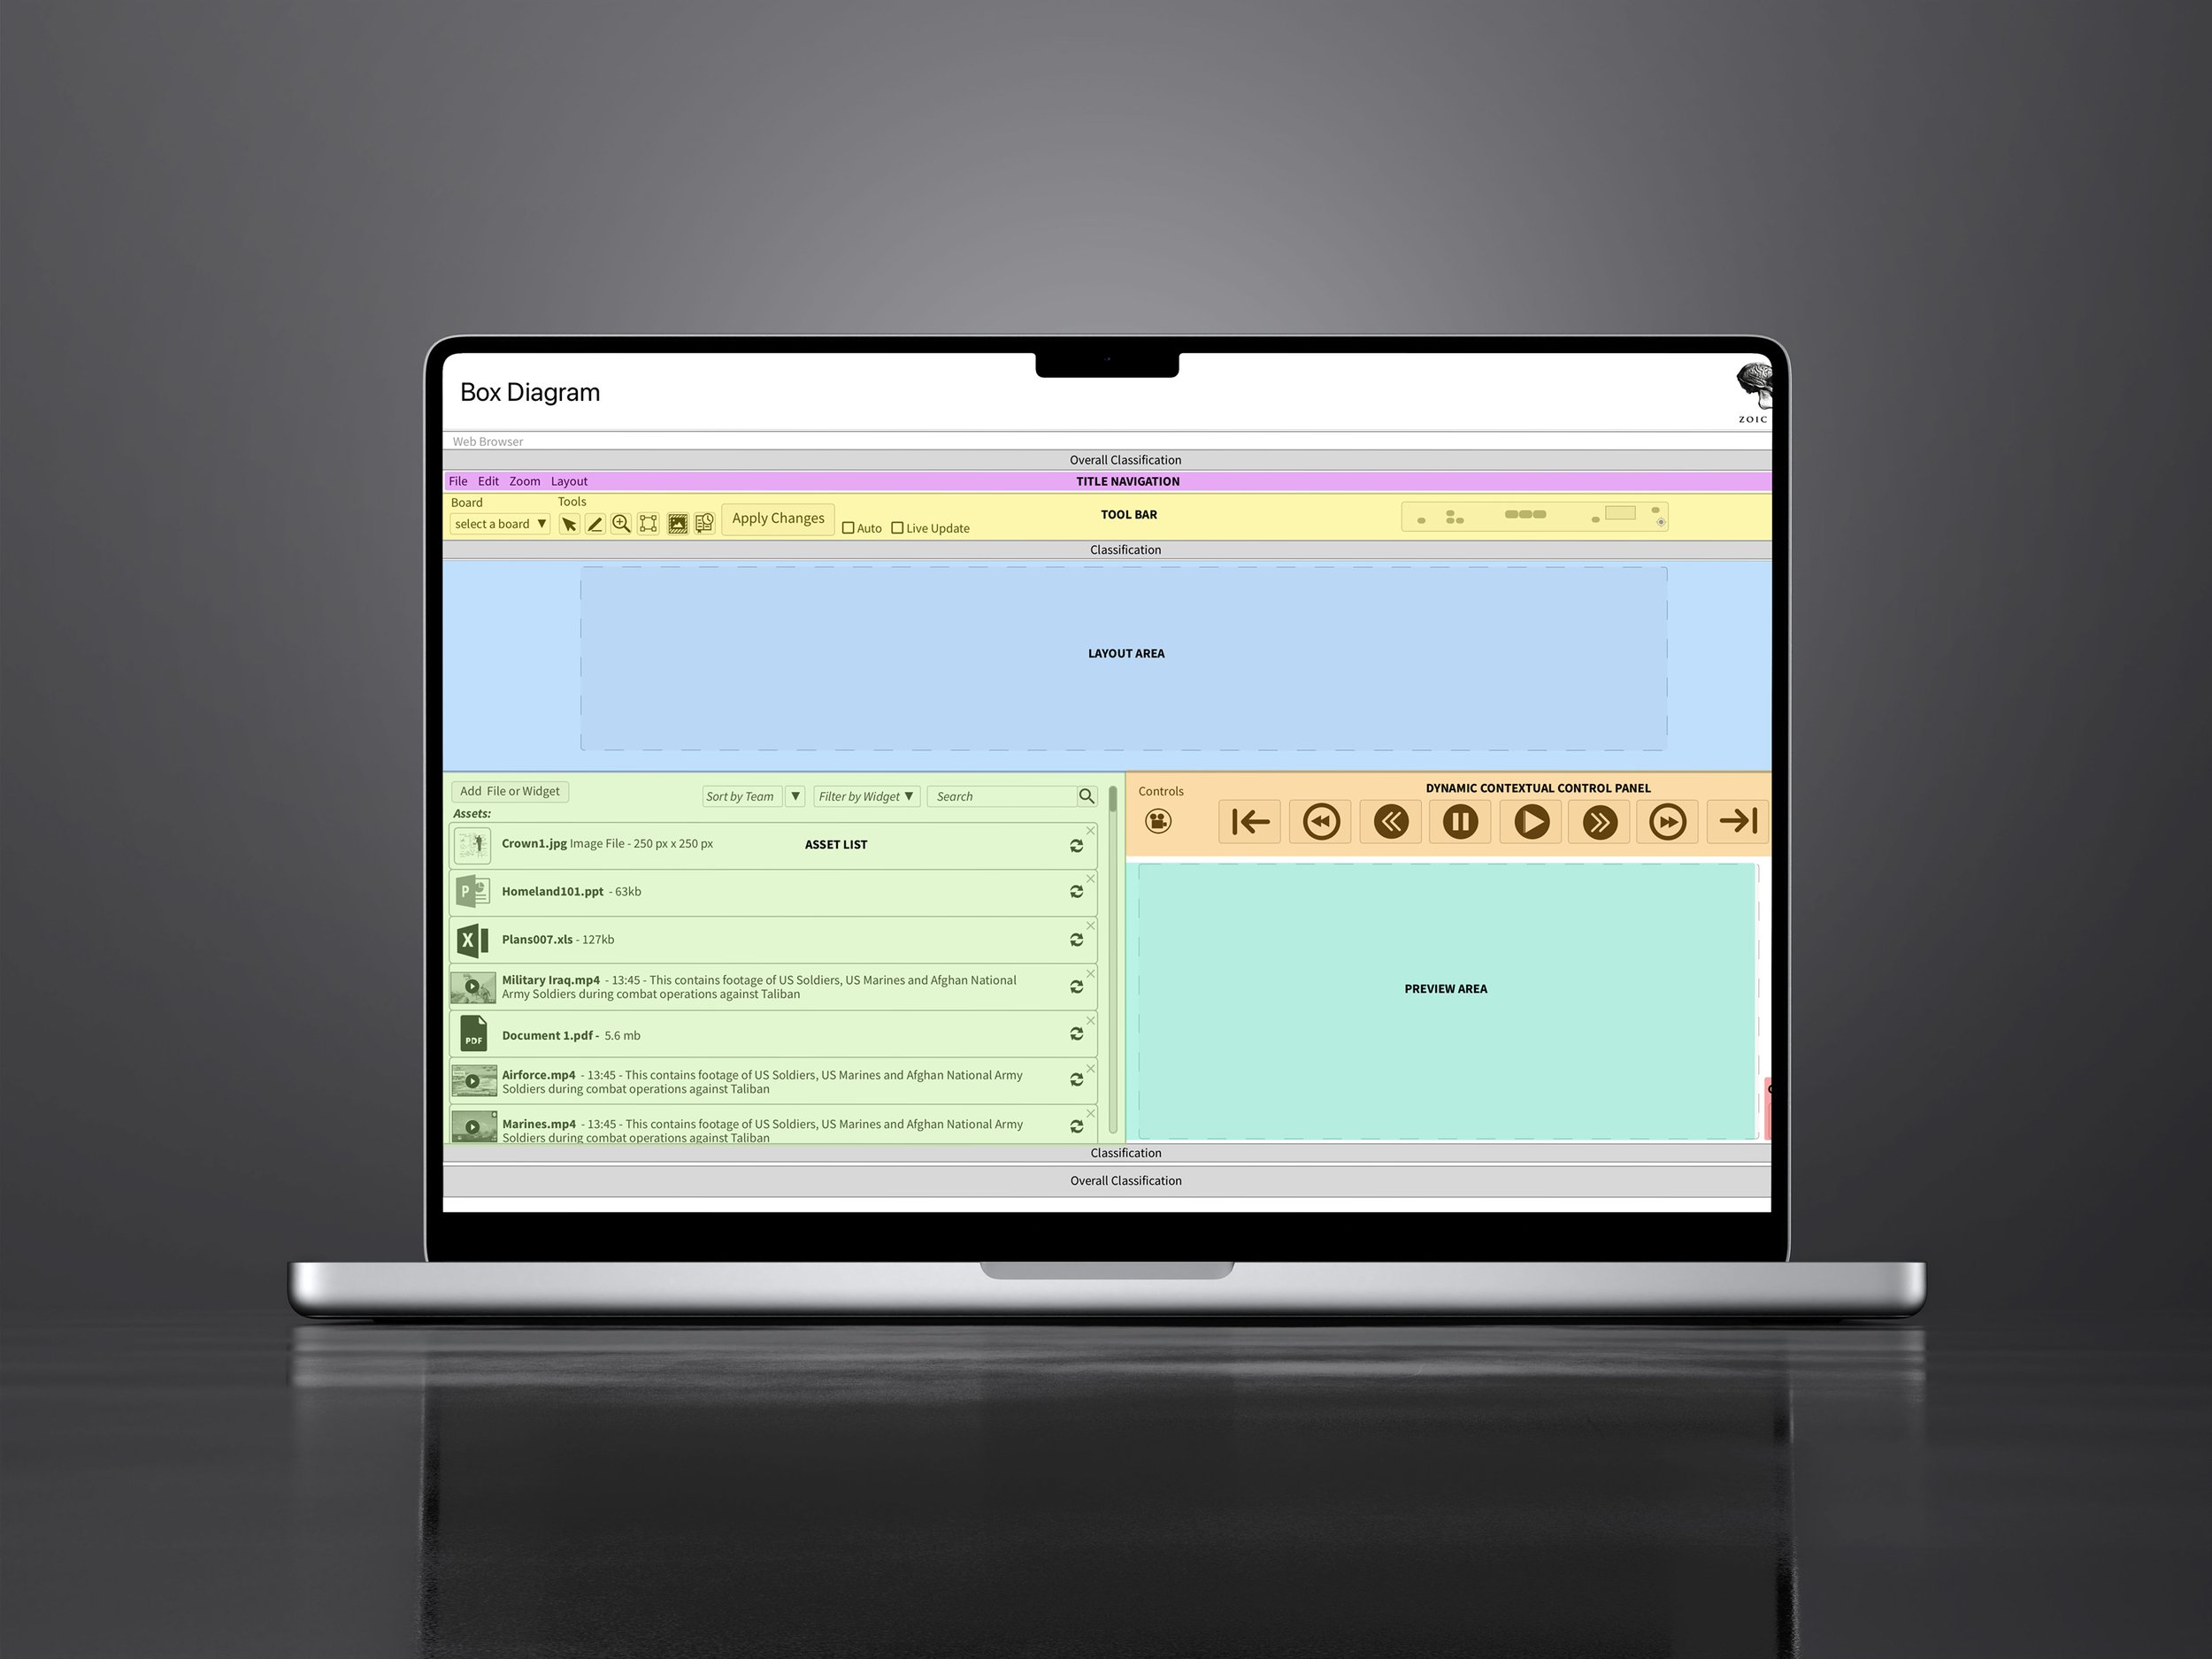
Box Diagram - sections of UI
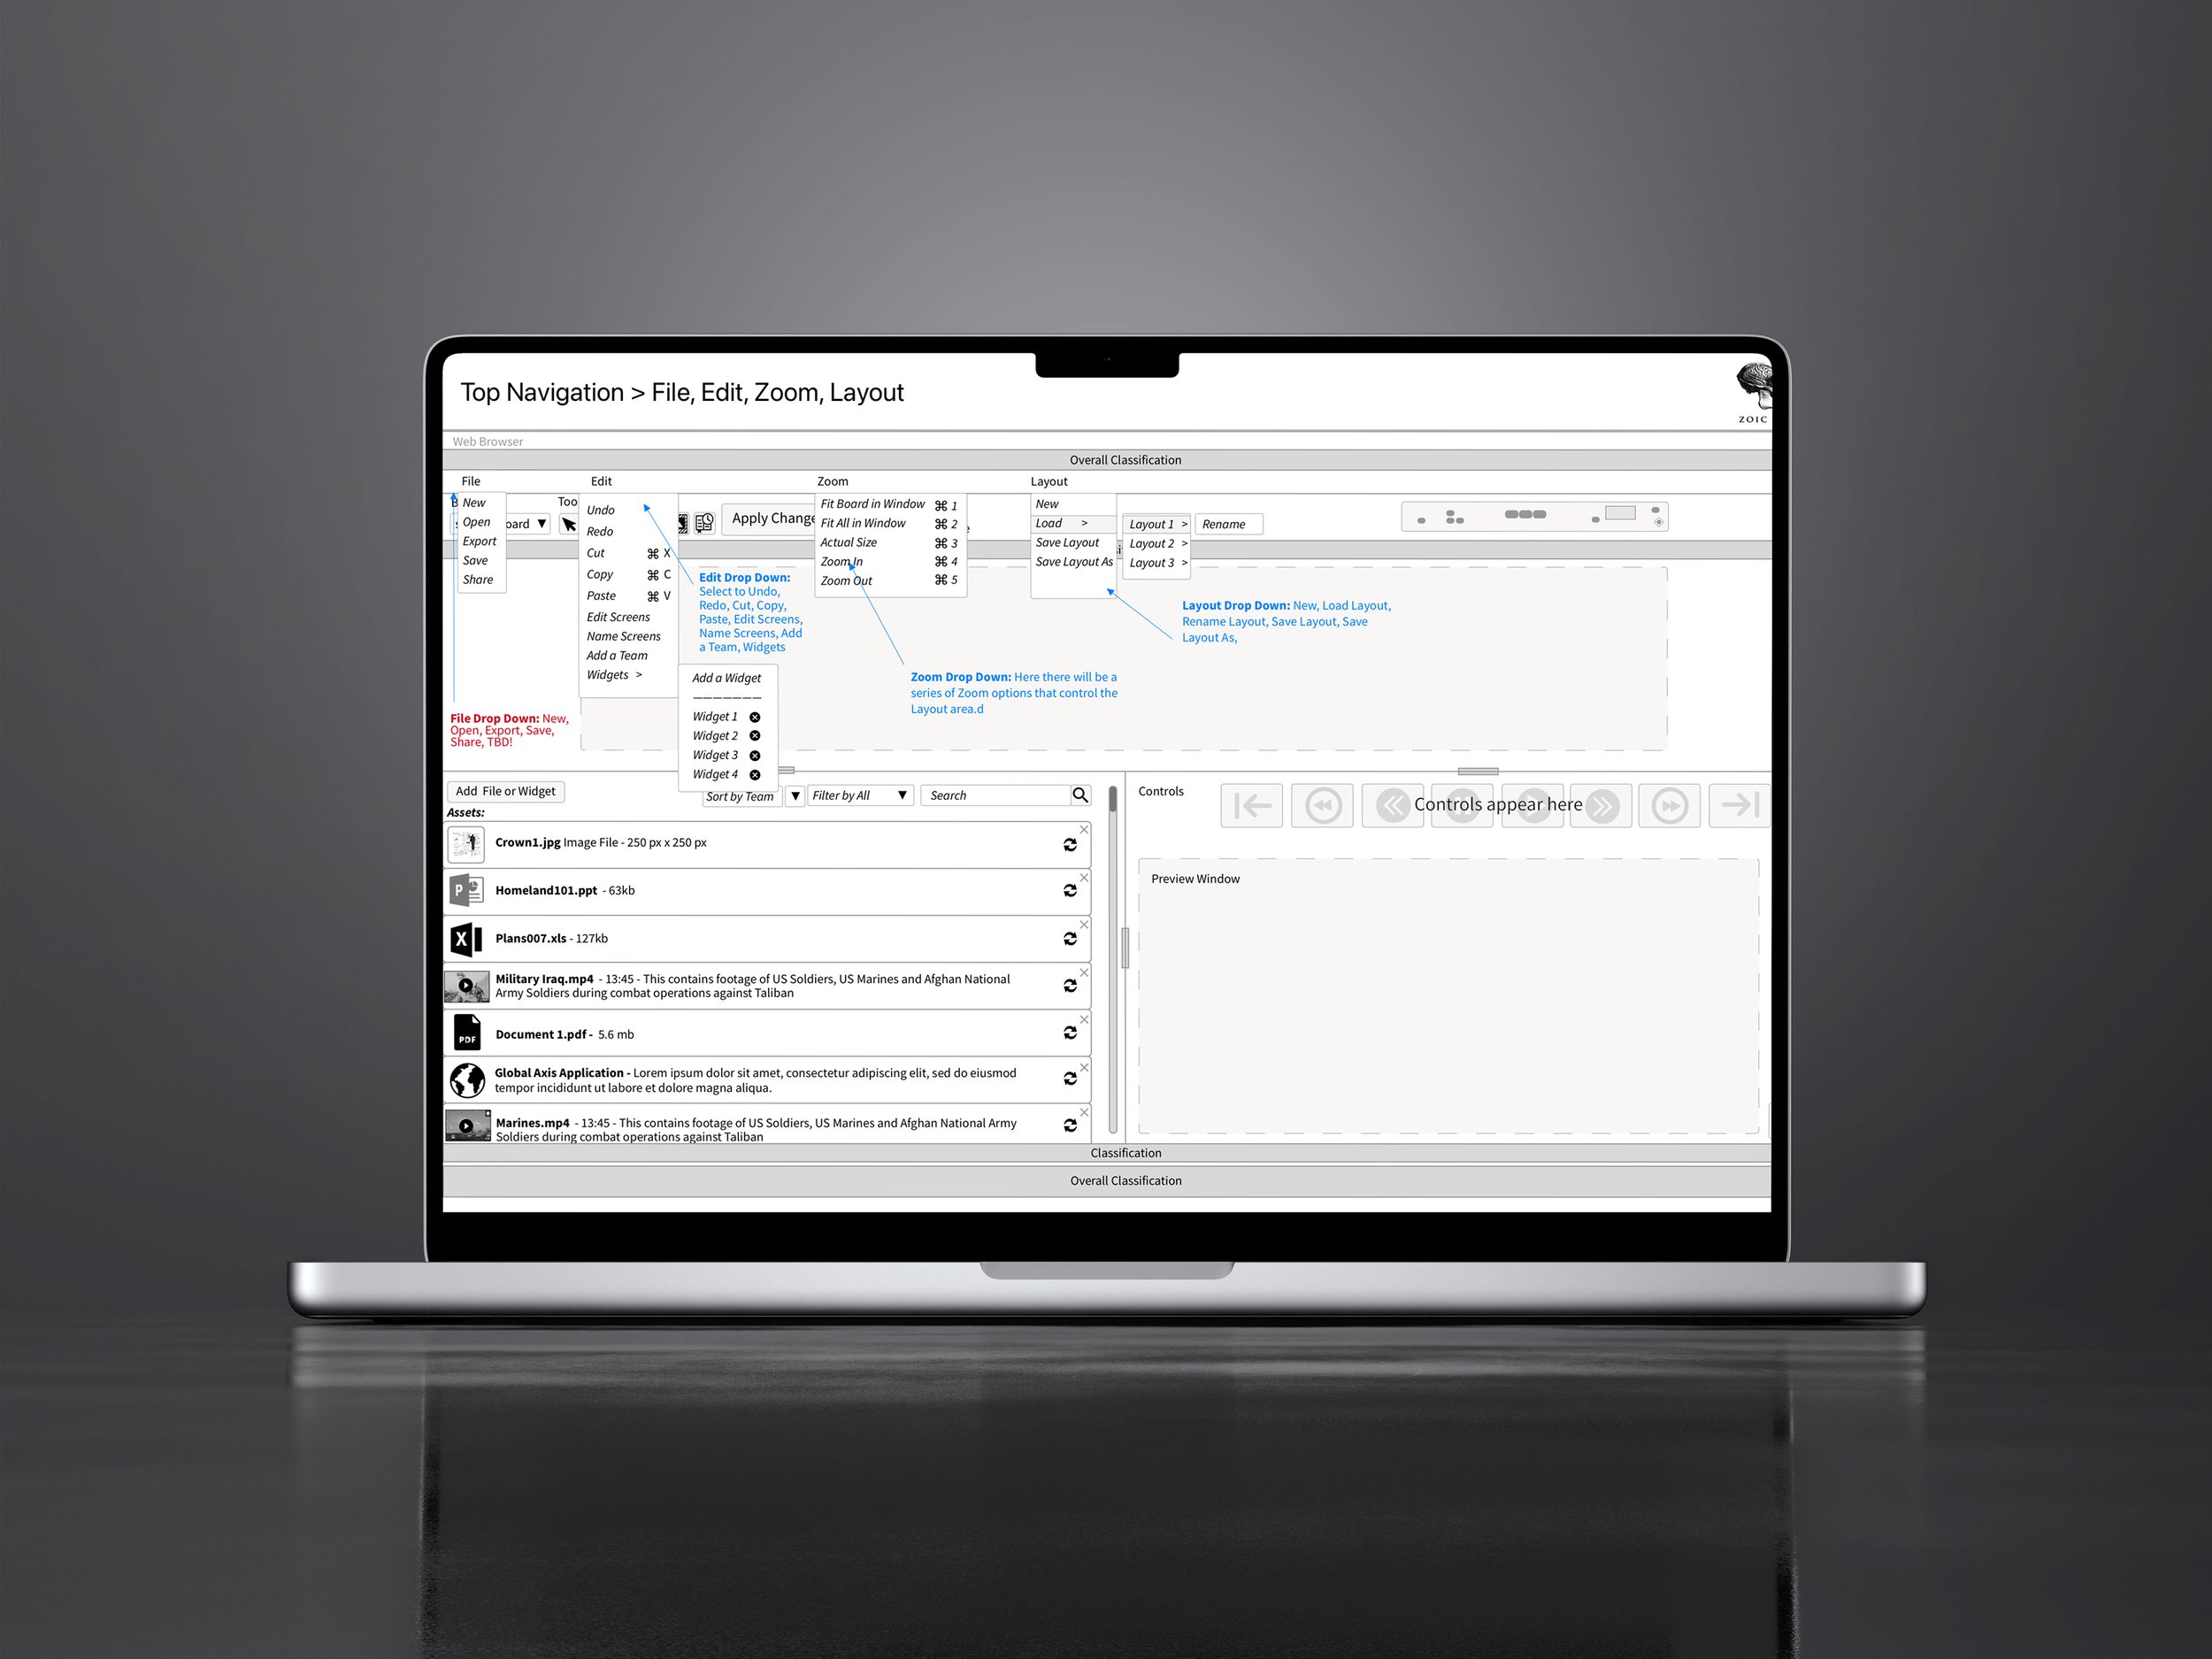
Navigation: File, Edit, Layout
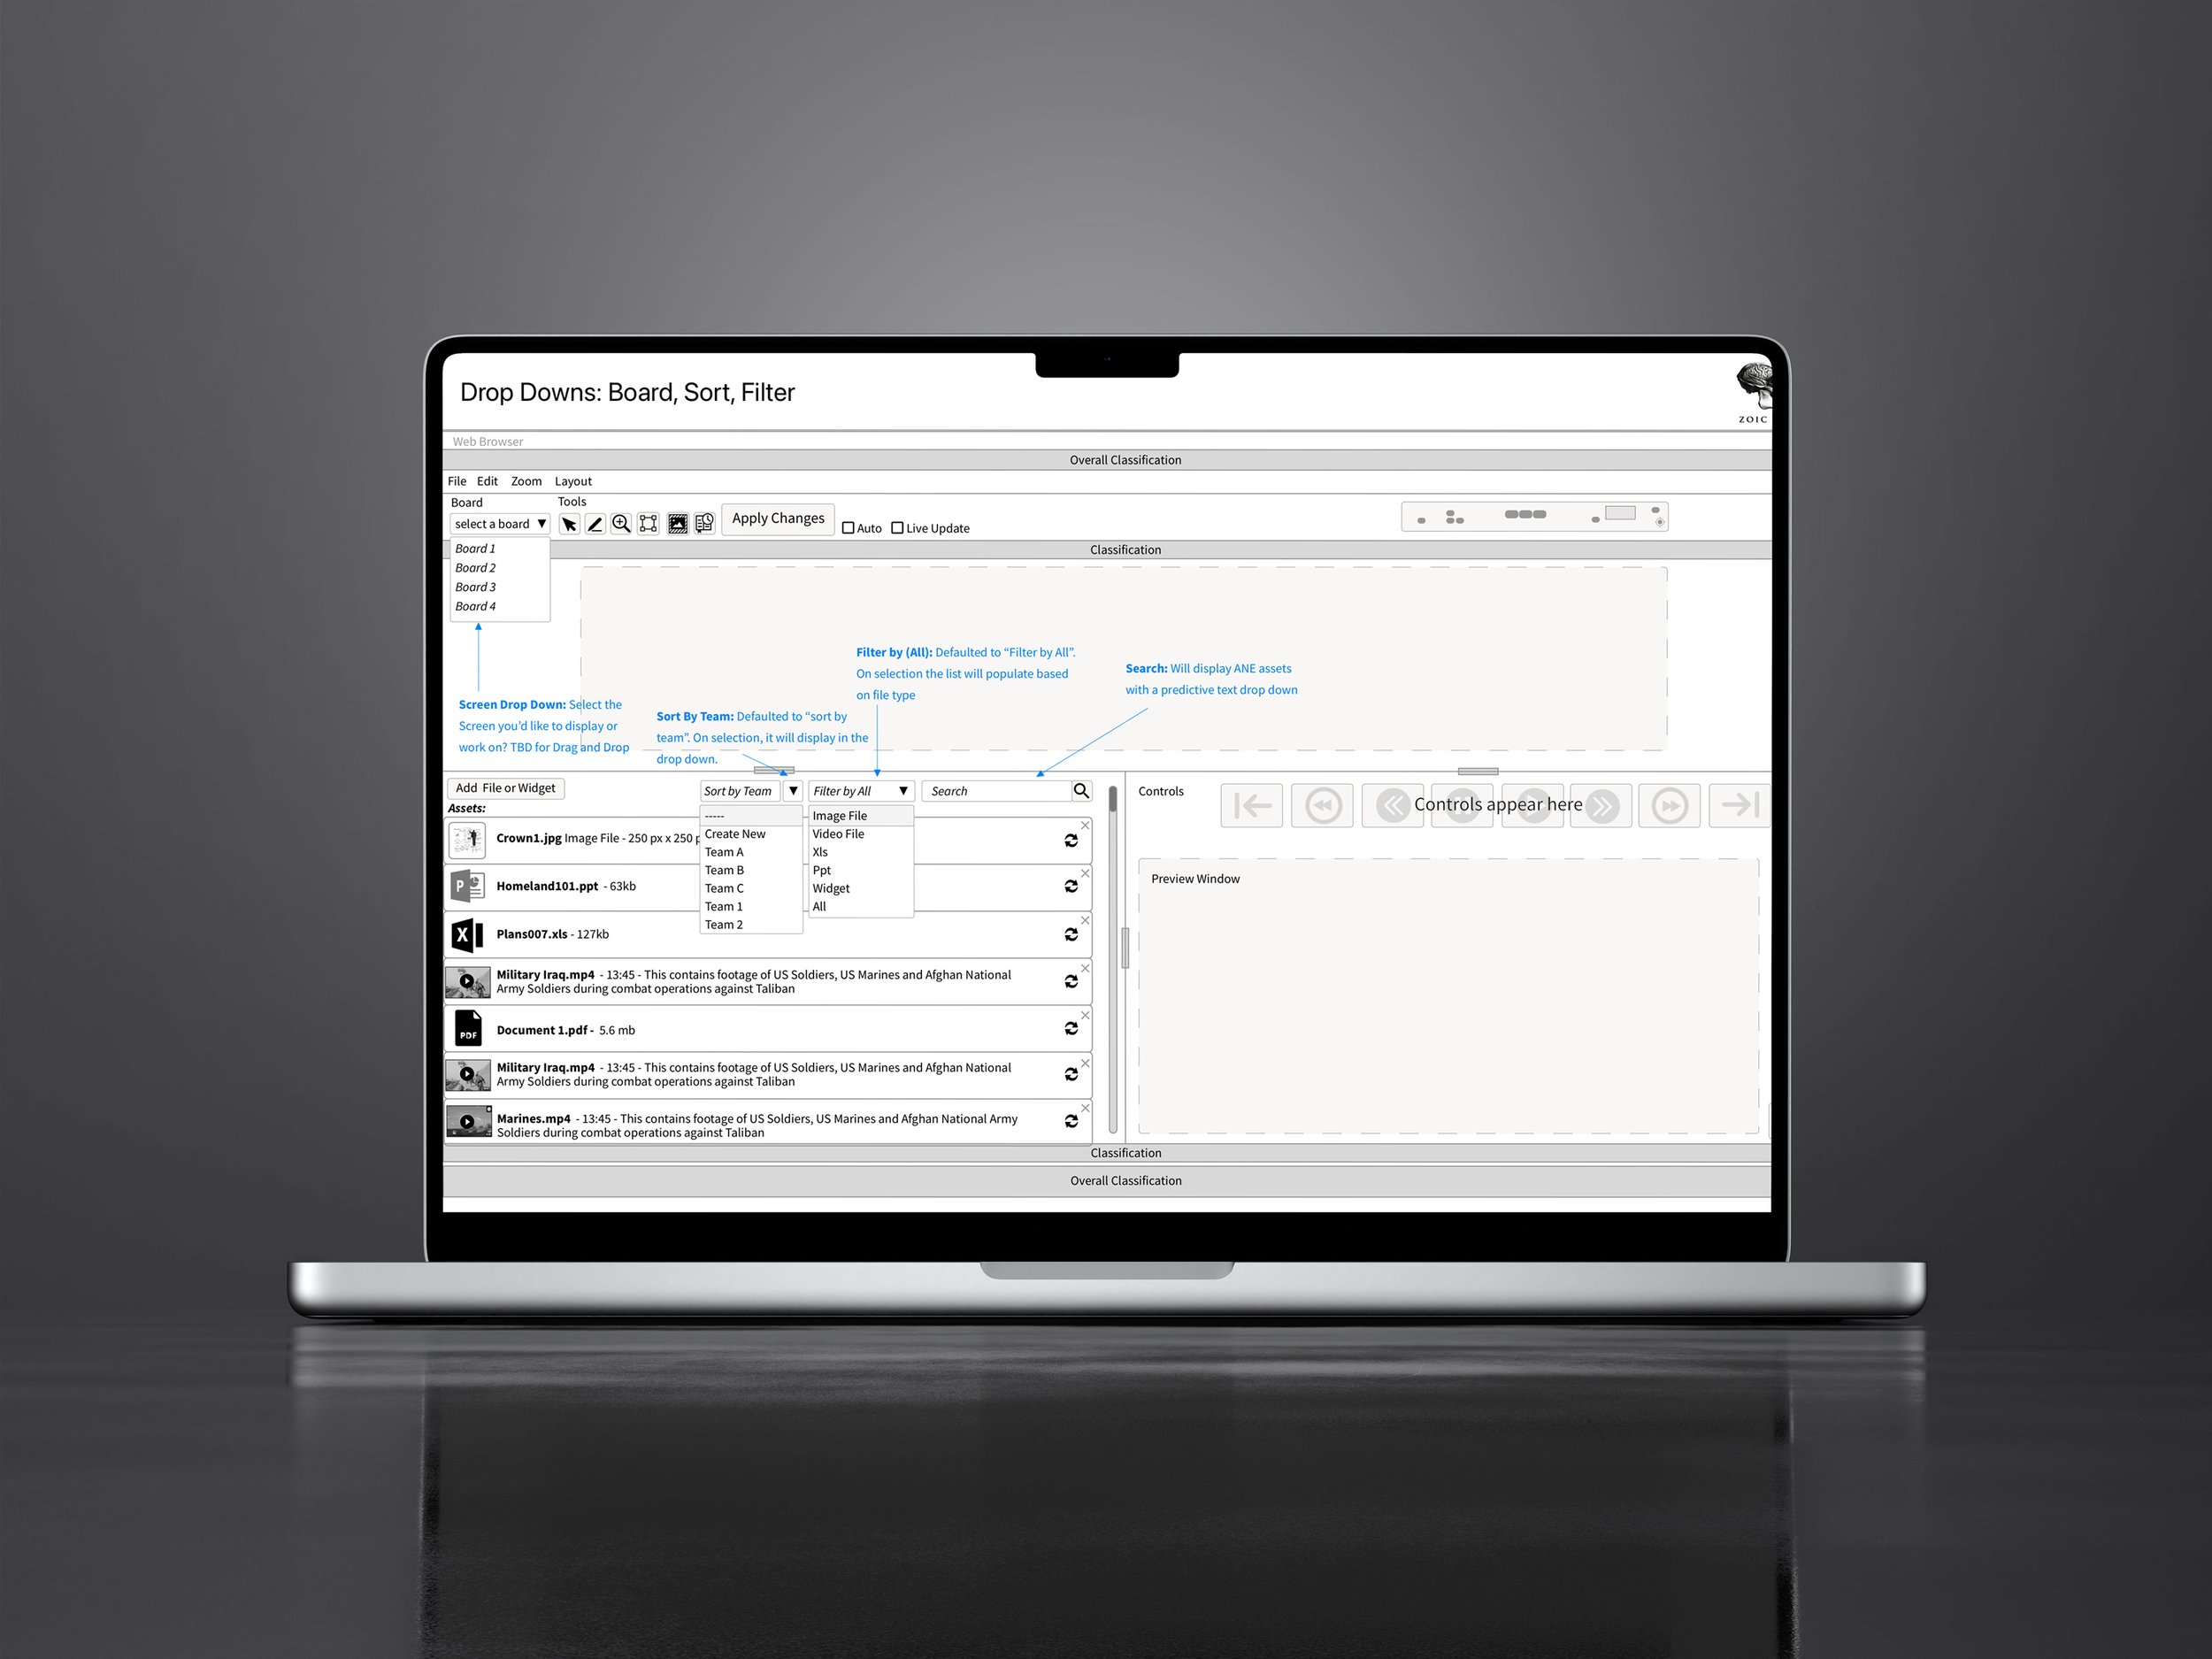
DropDowns
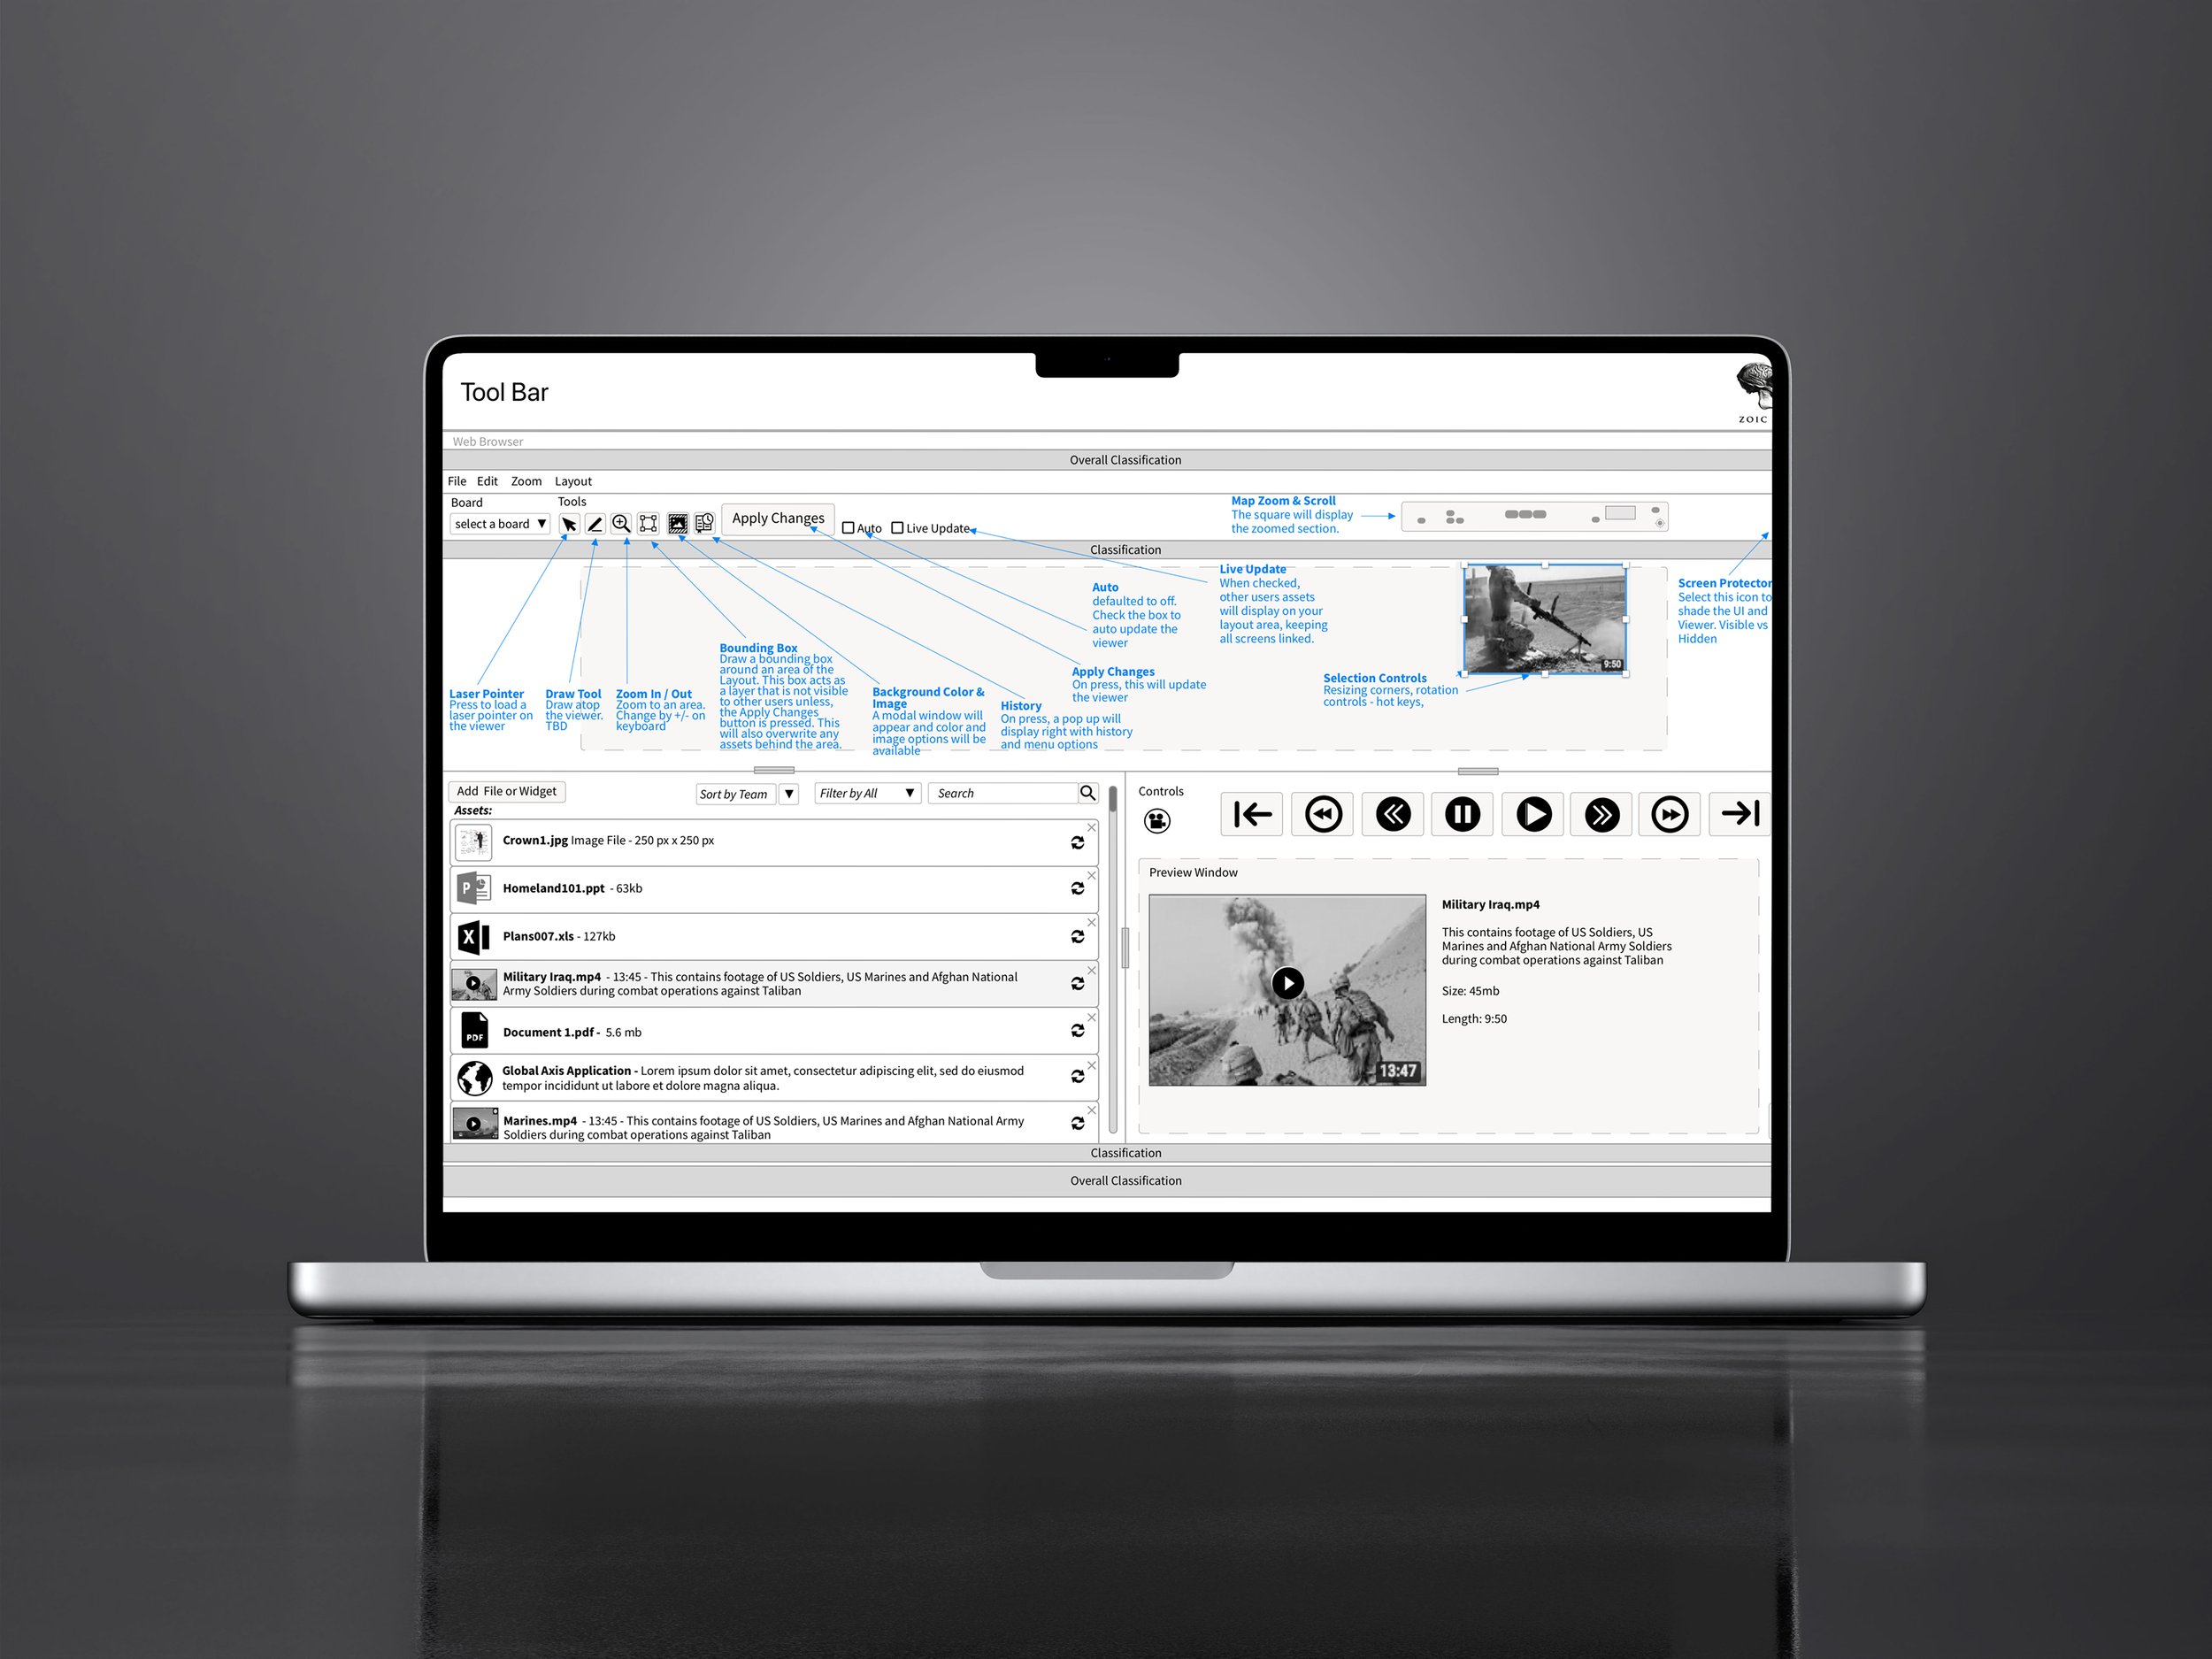
Tool Bar
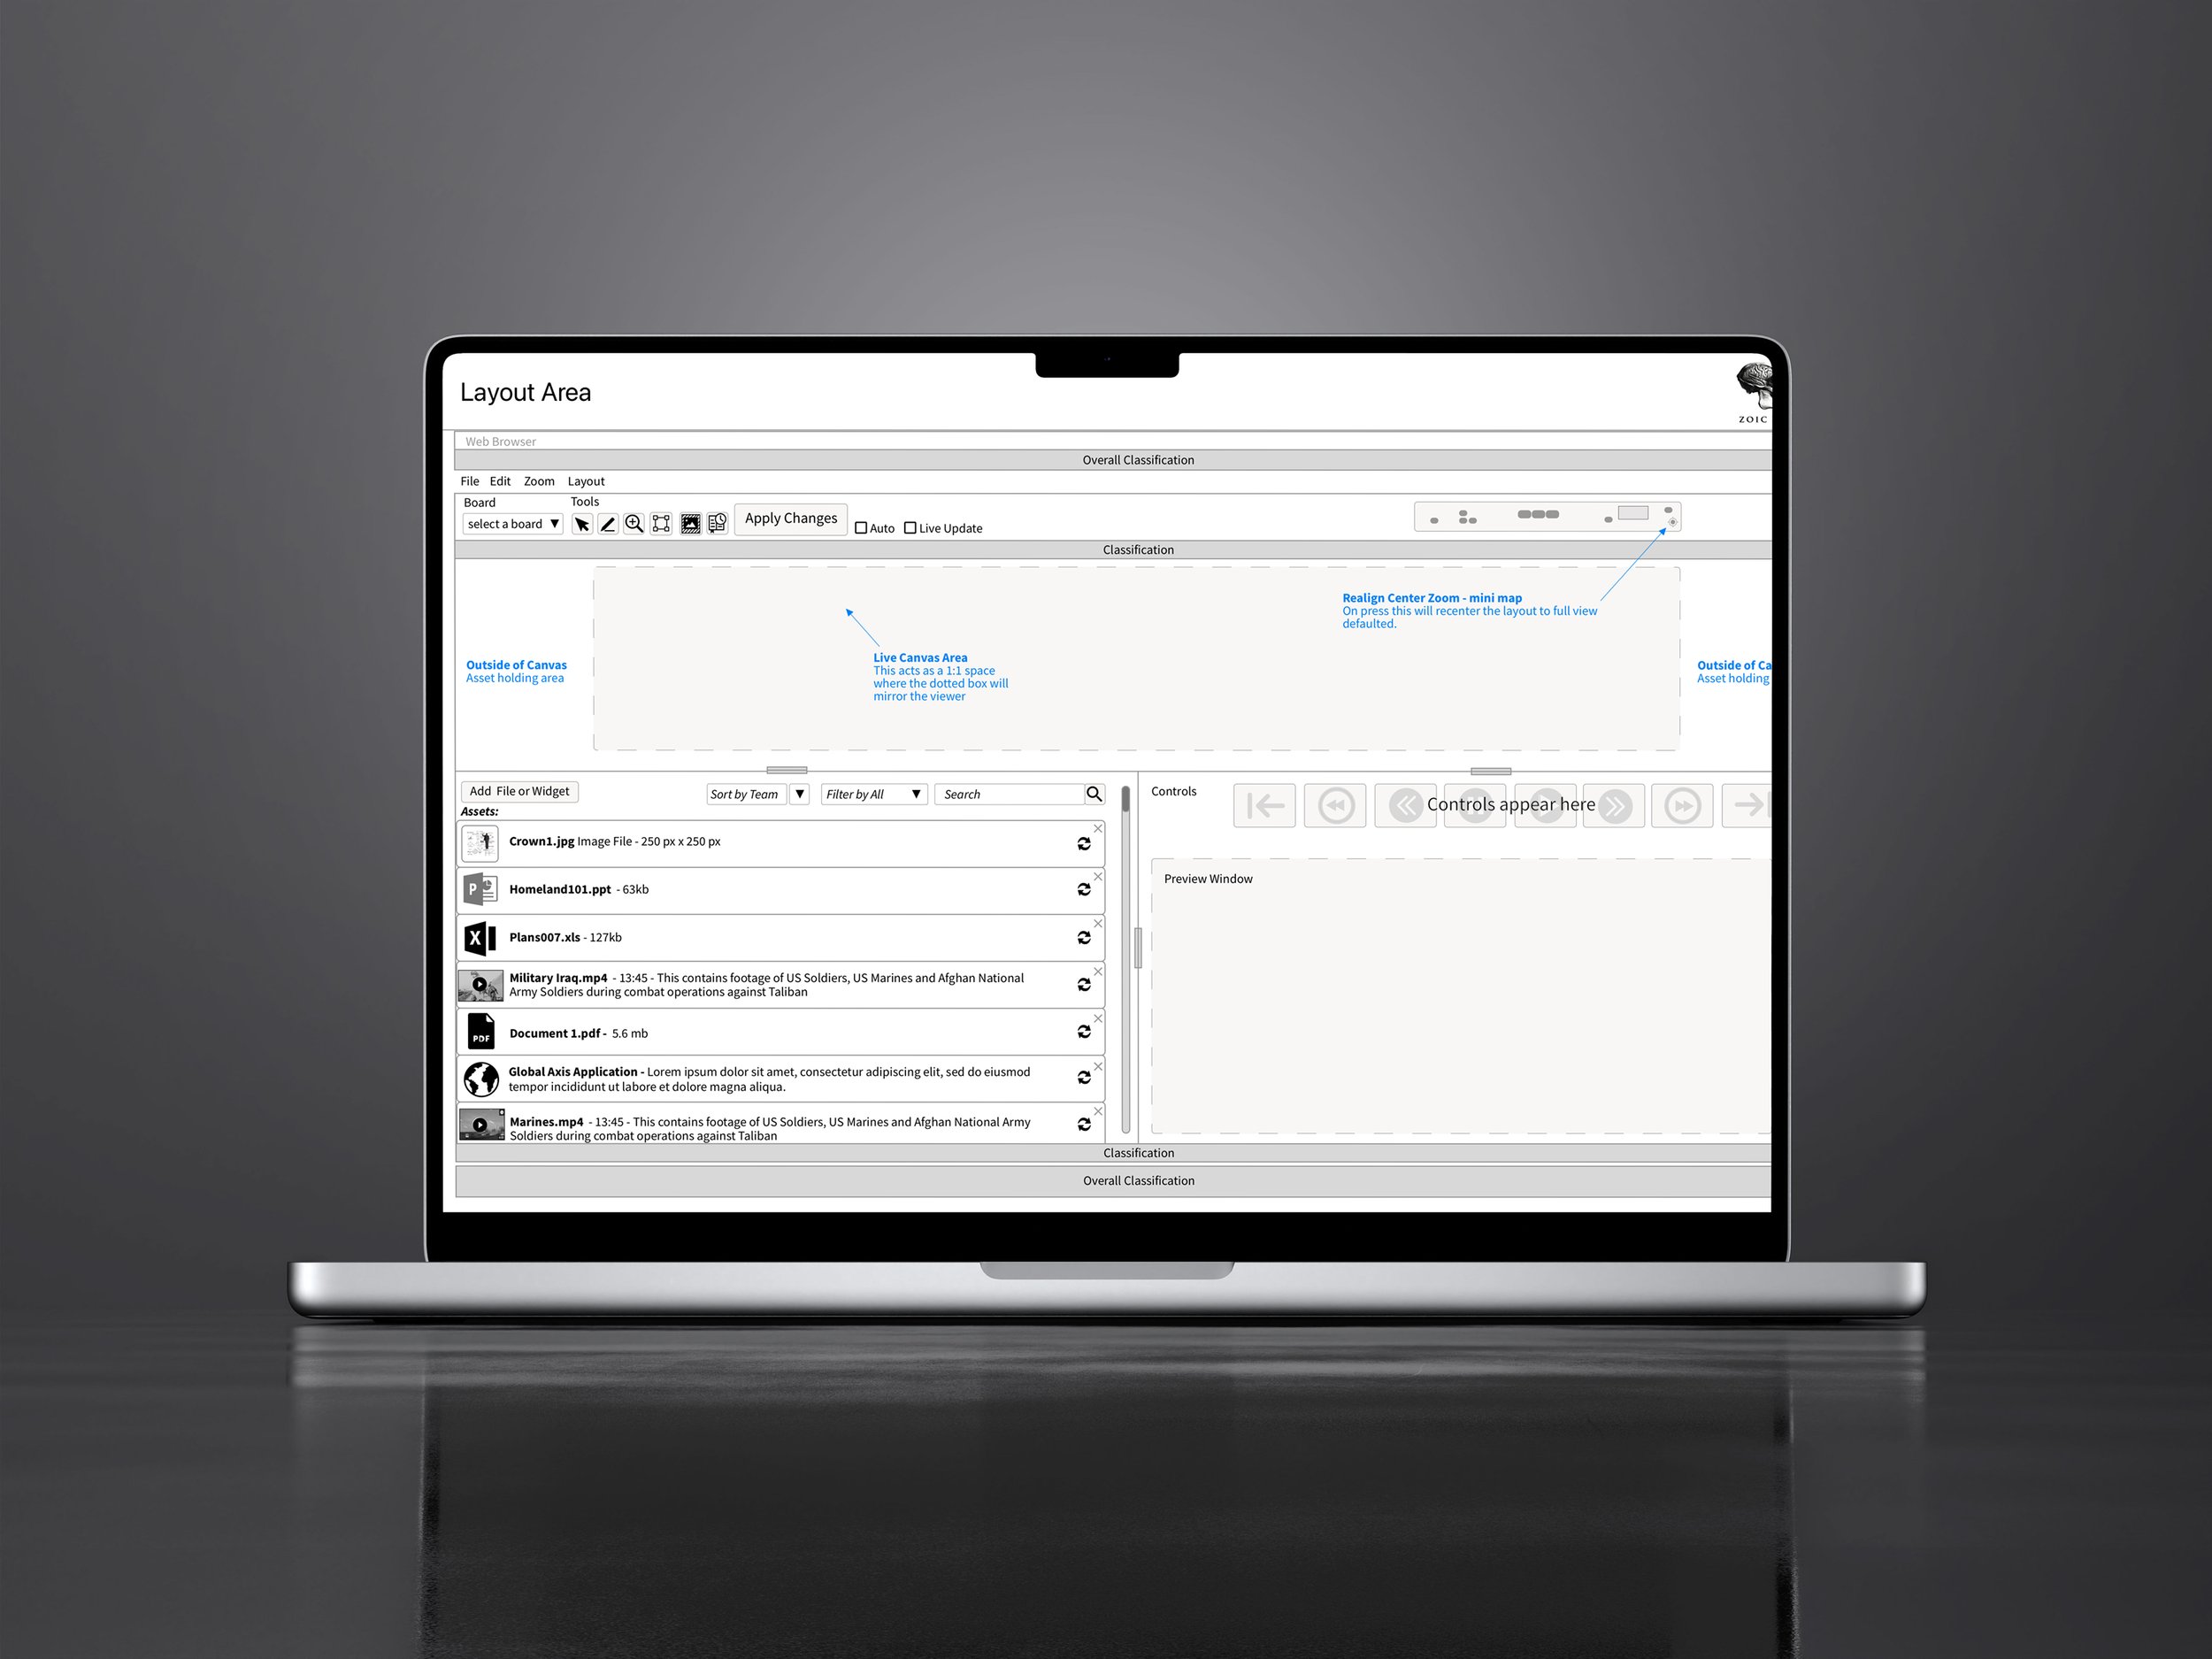
Layout Area
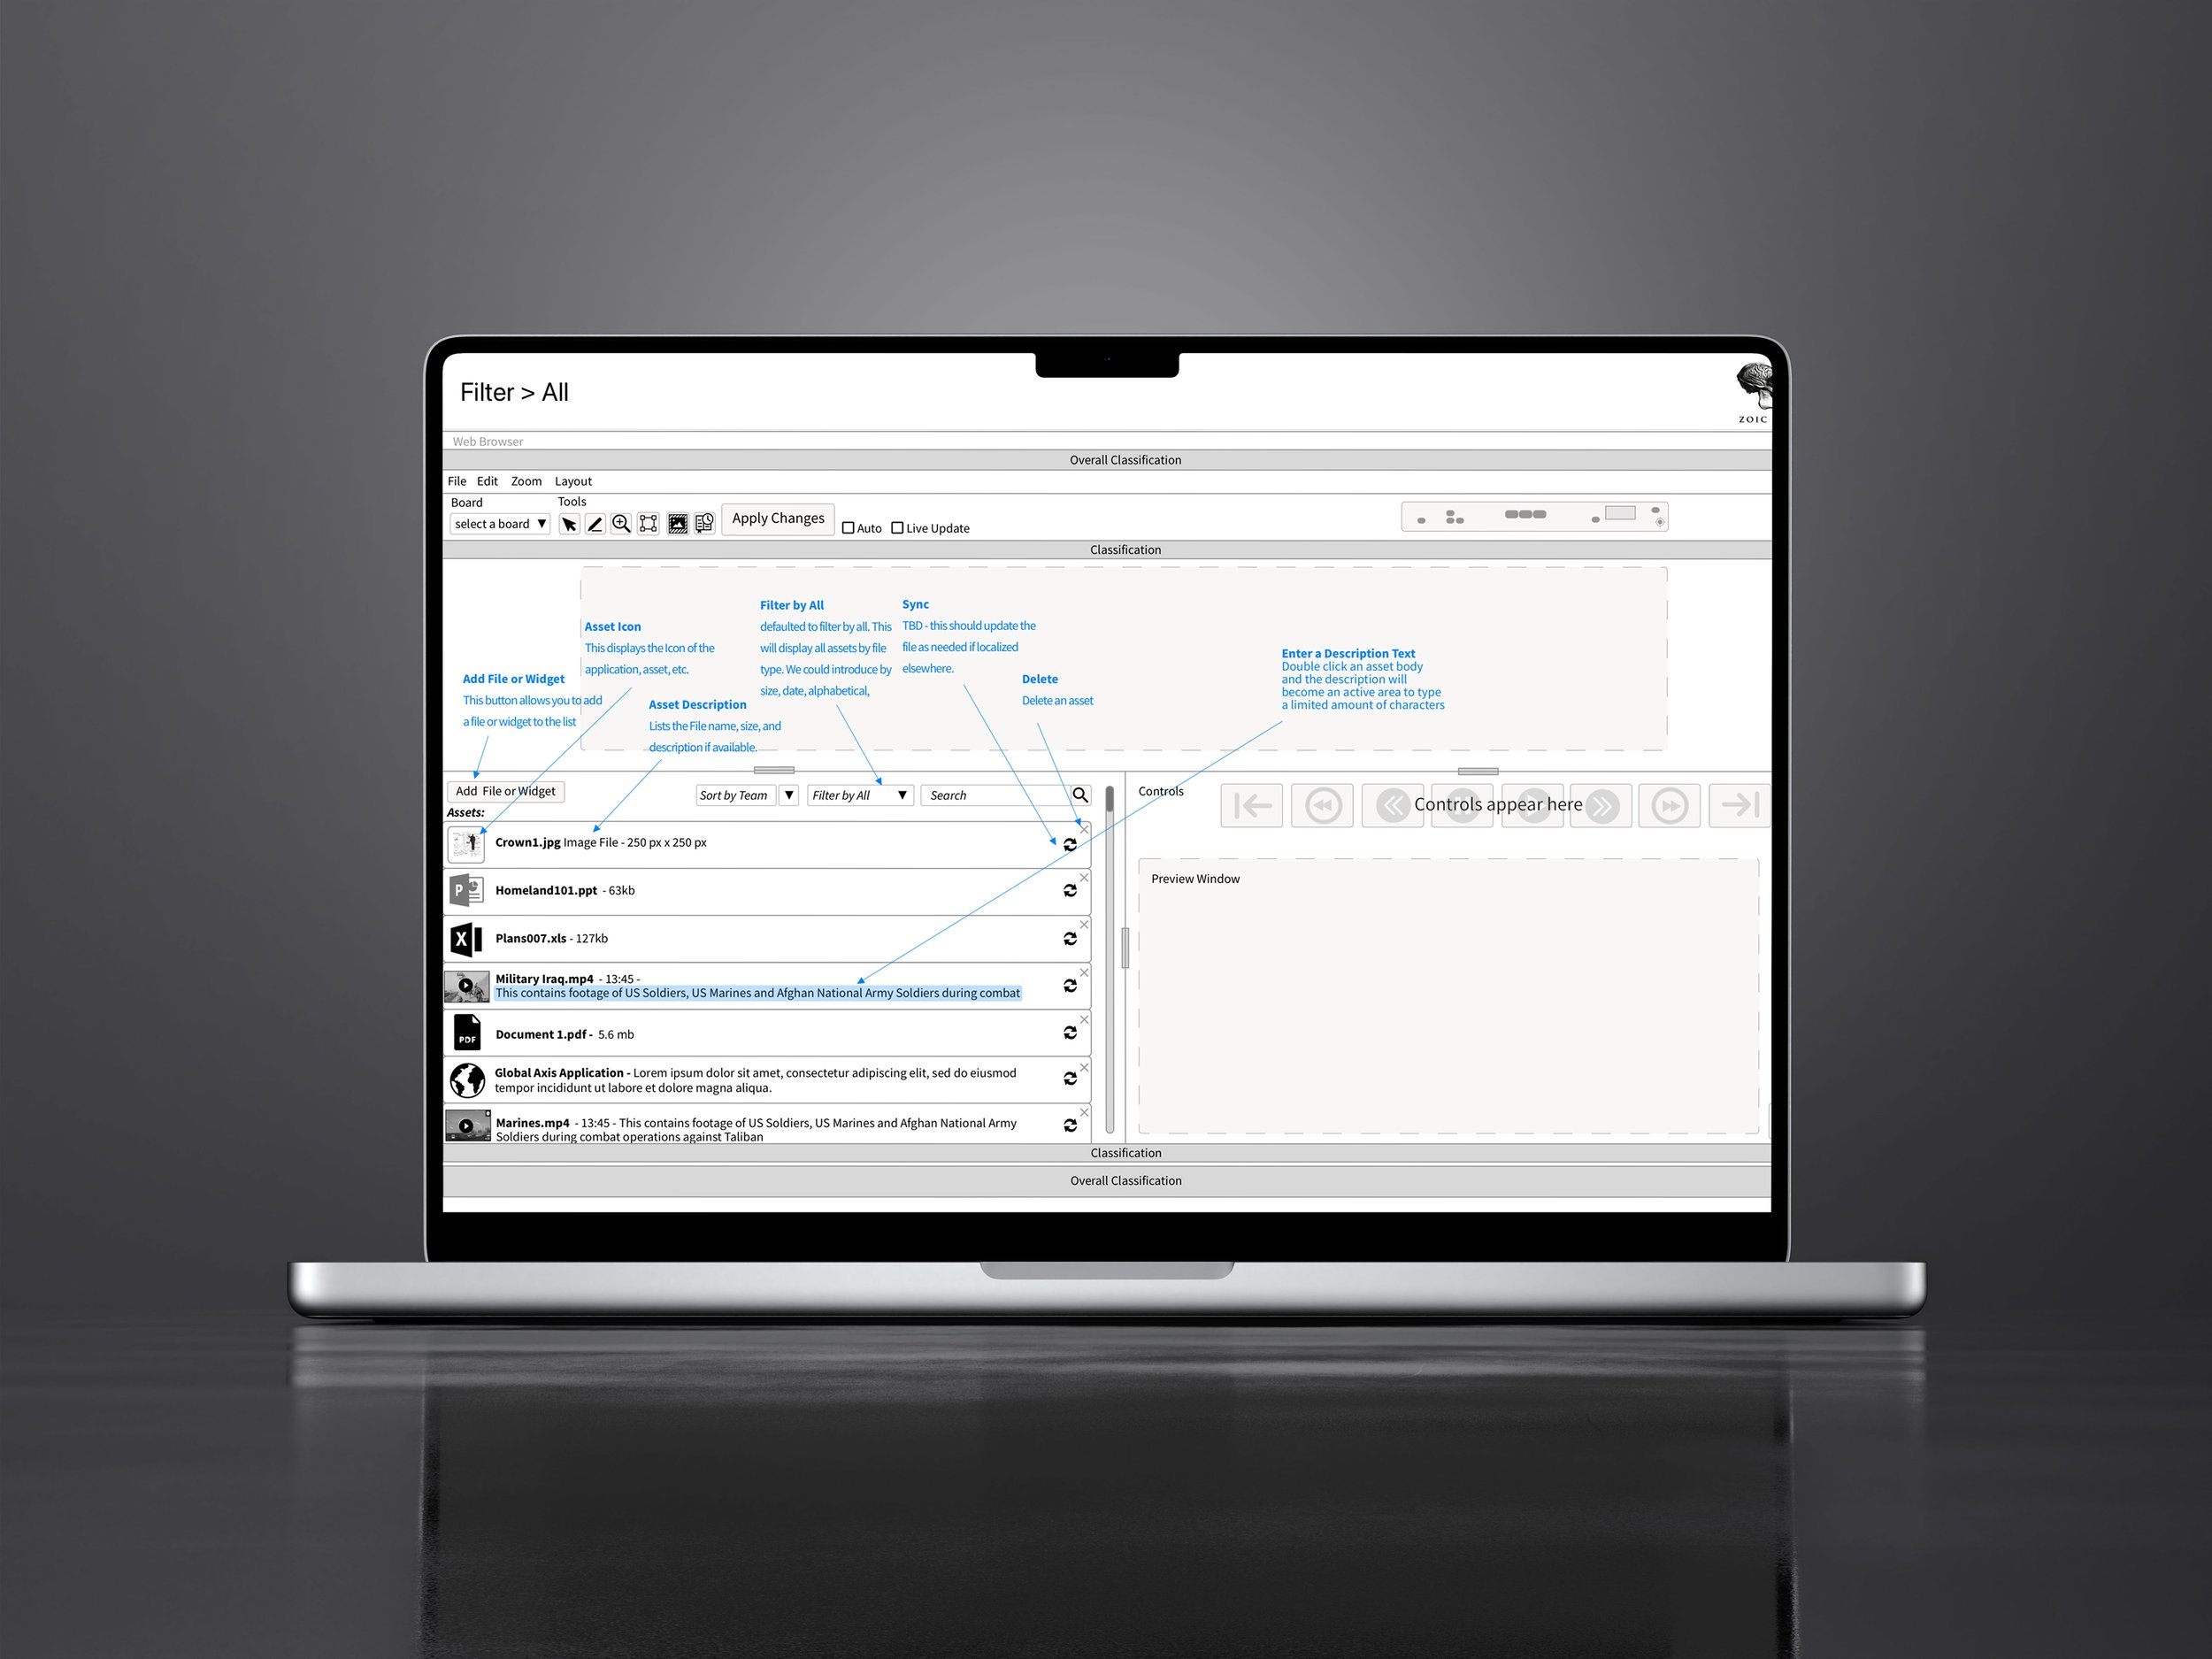
Filter by All
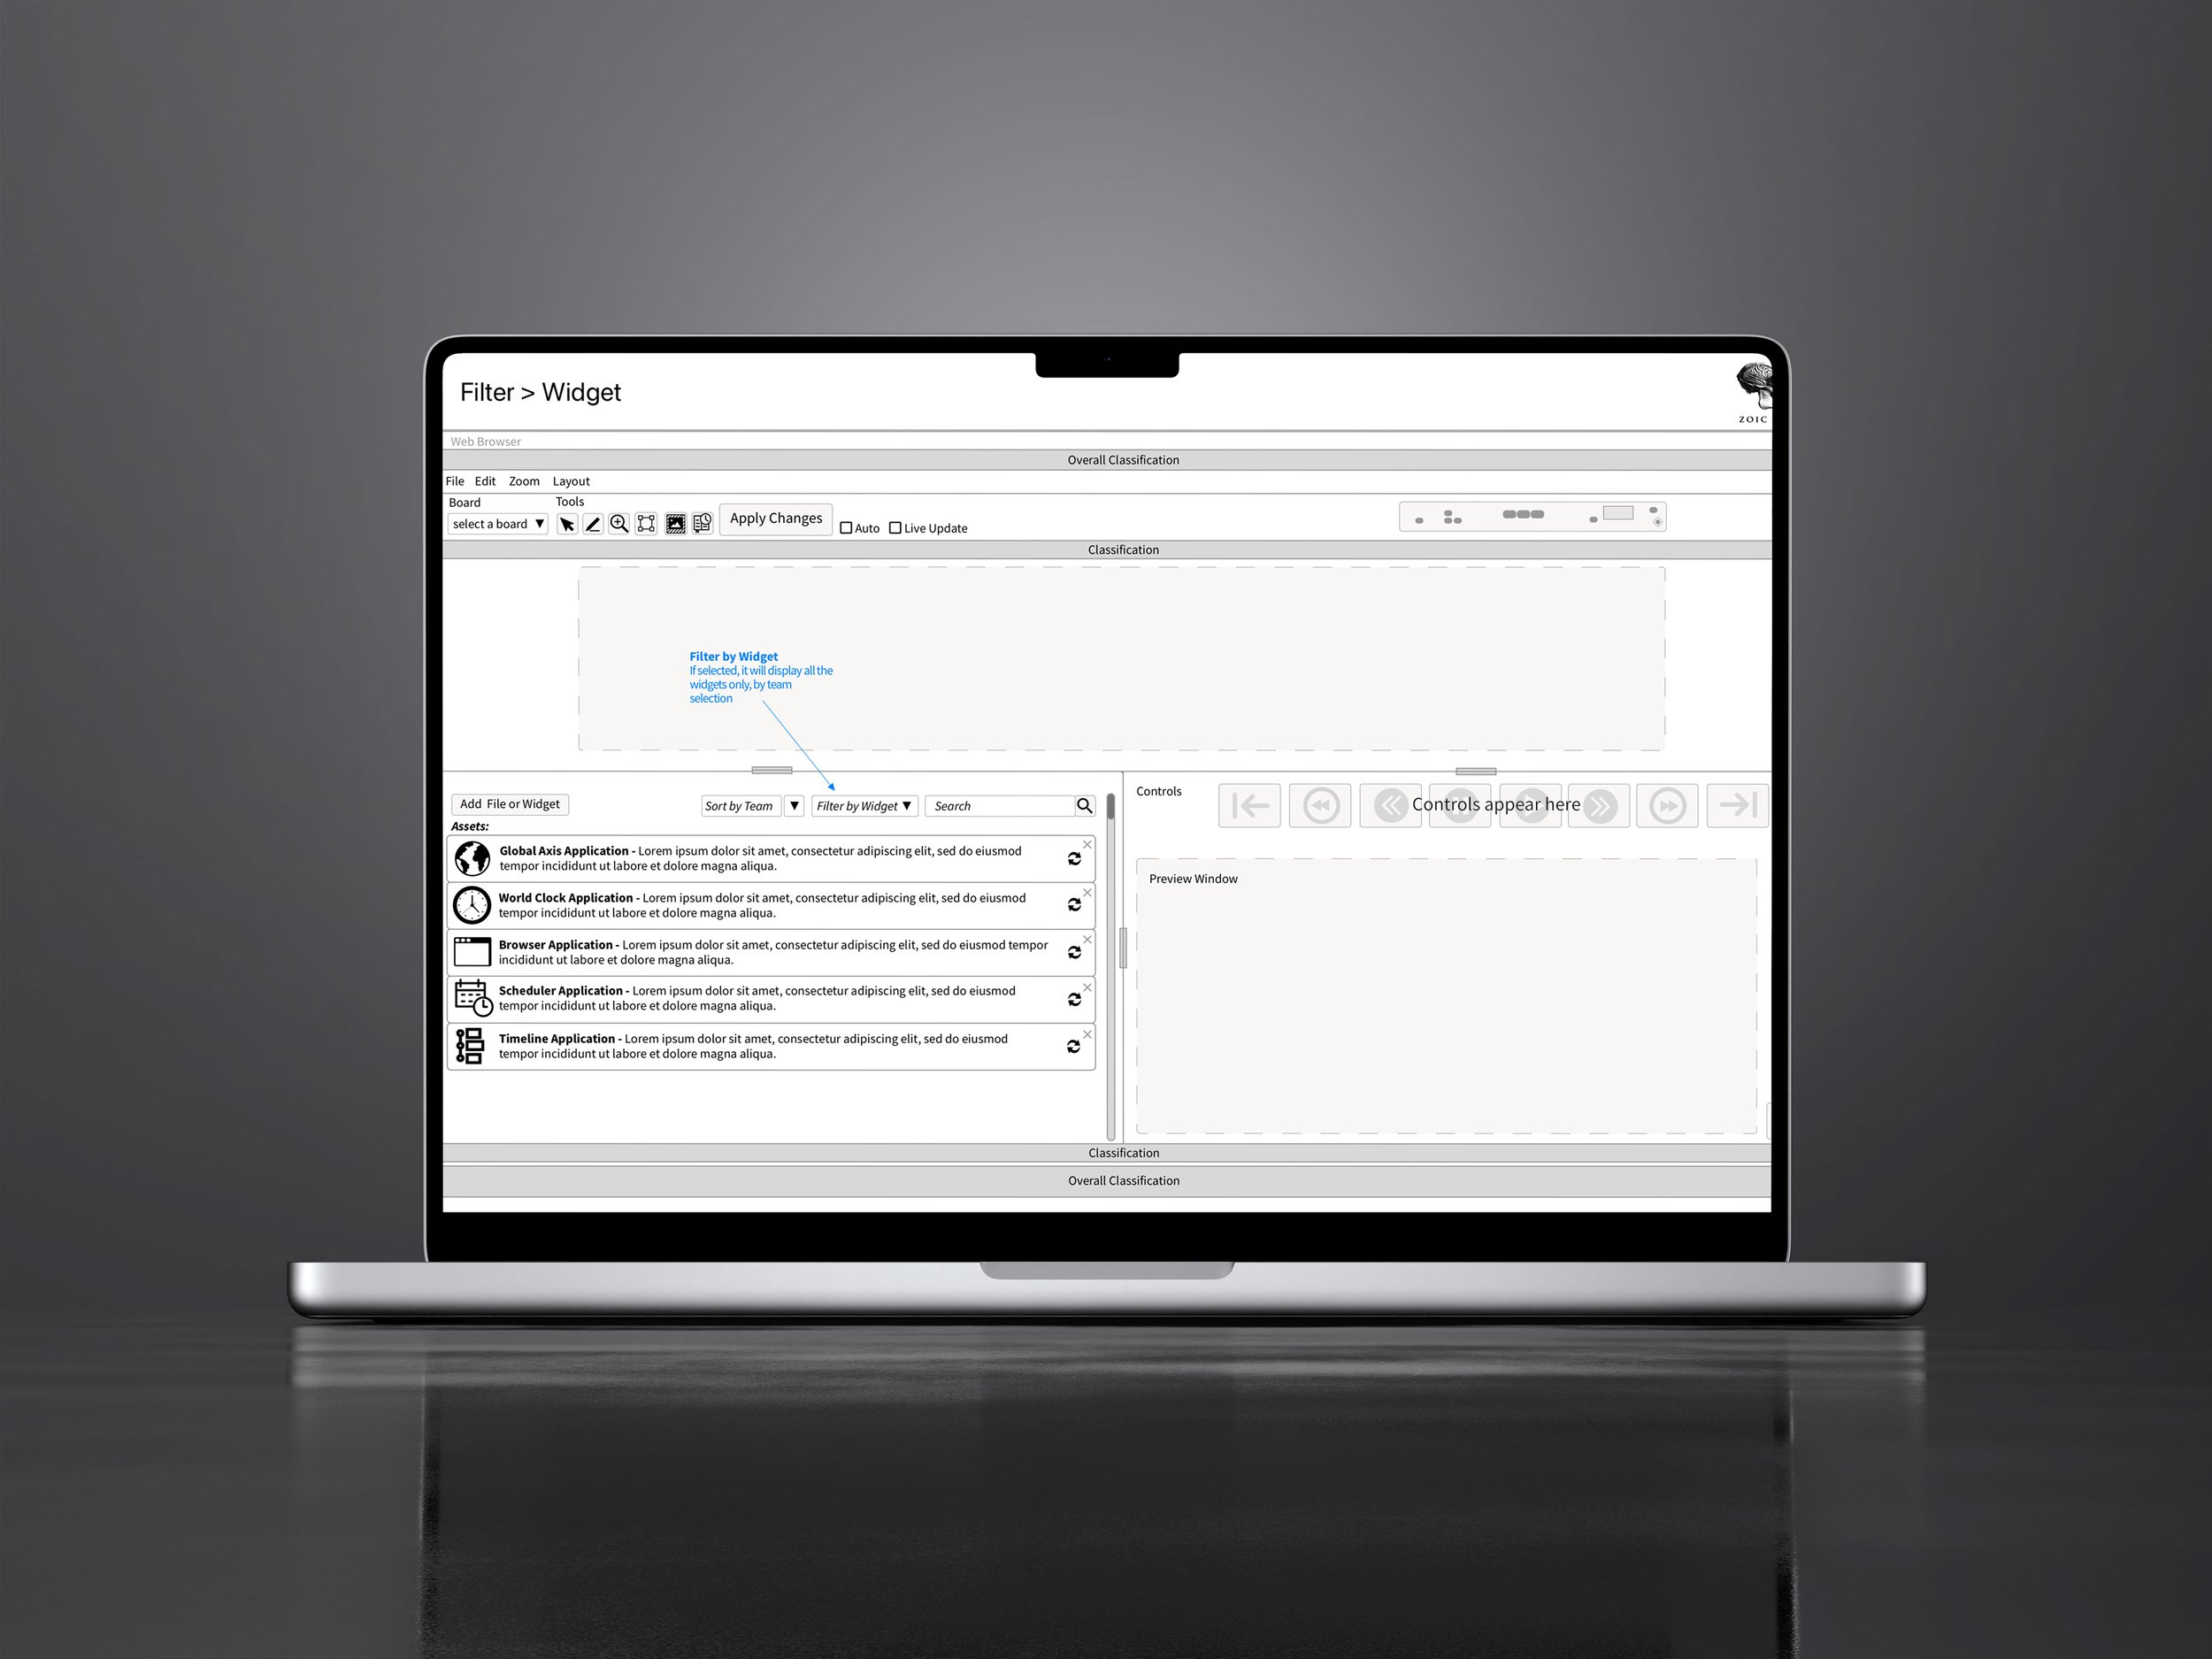
Filter by Widget
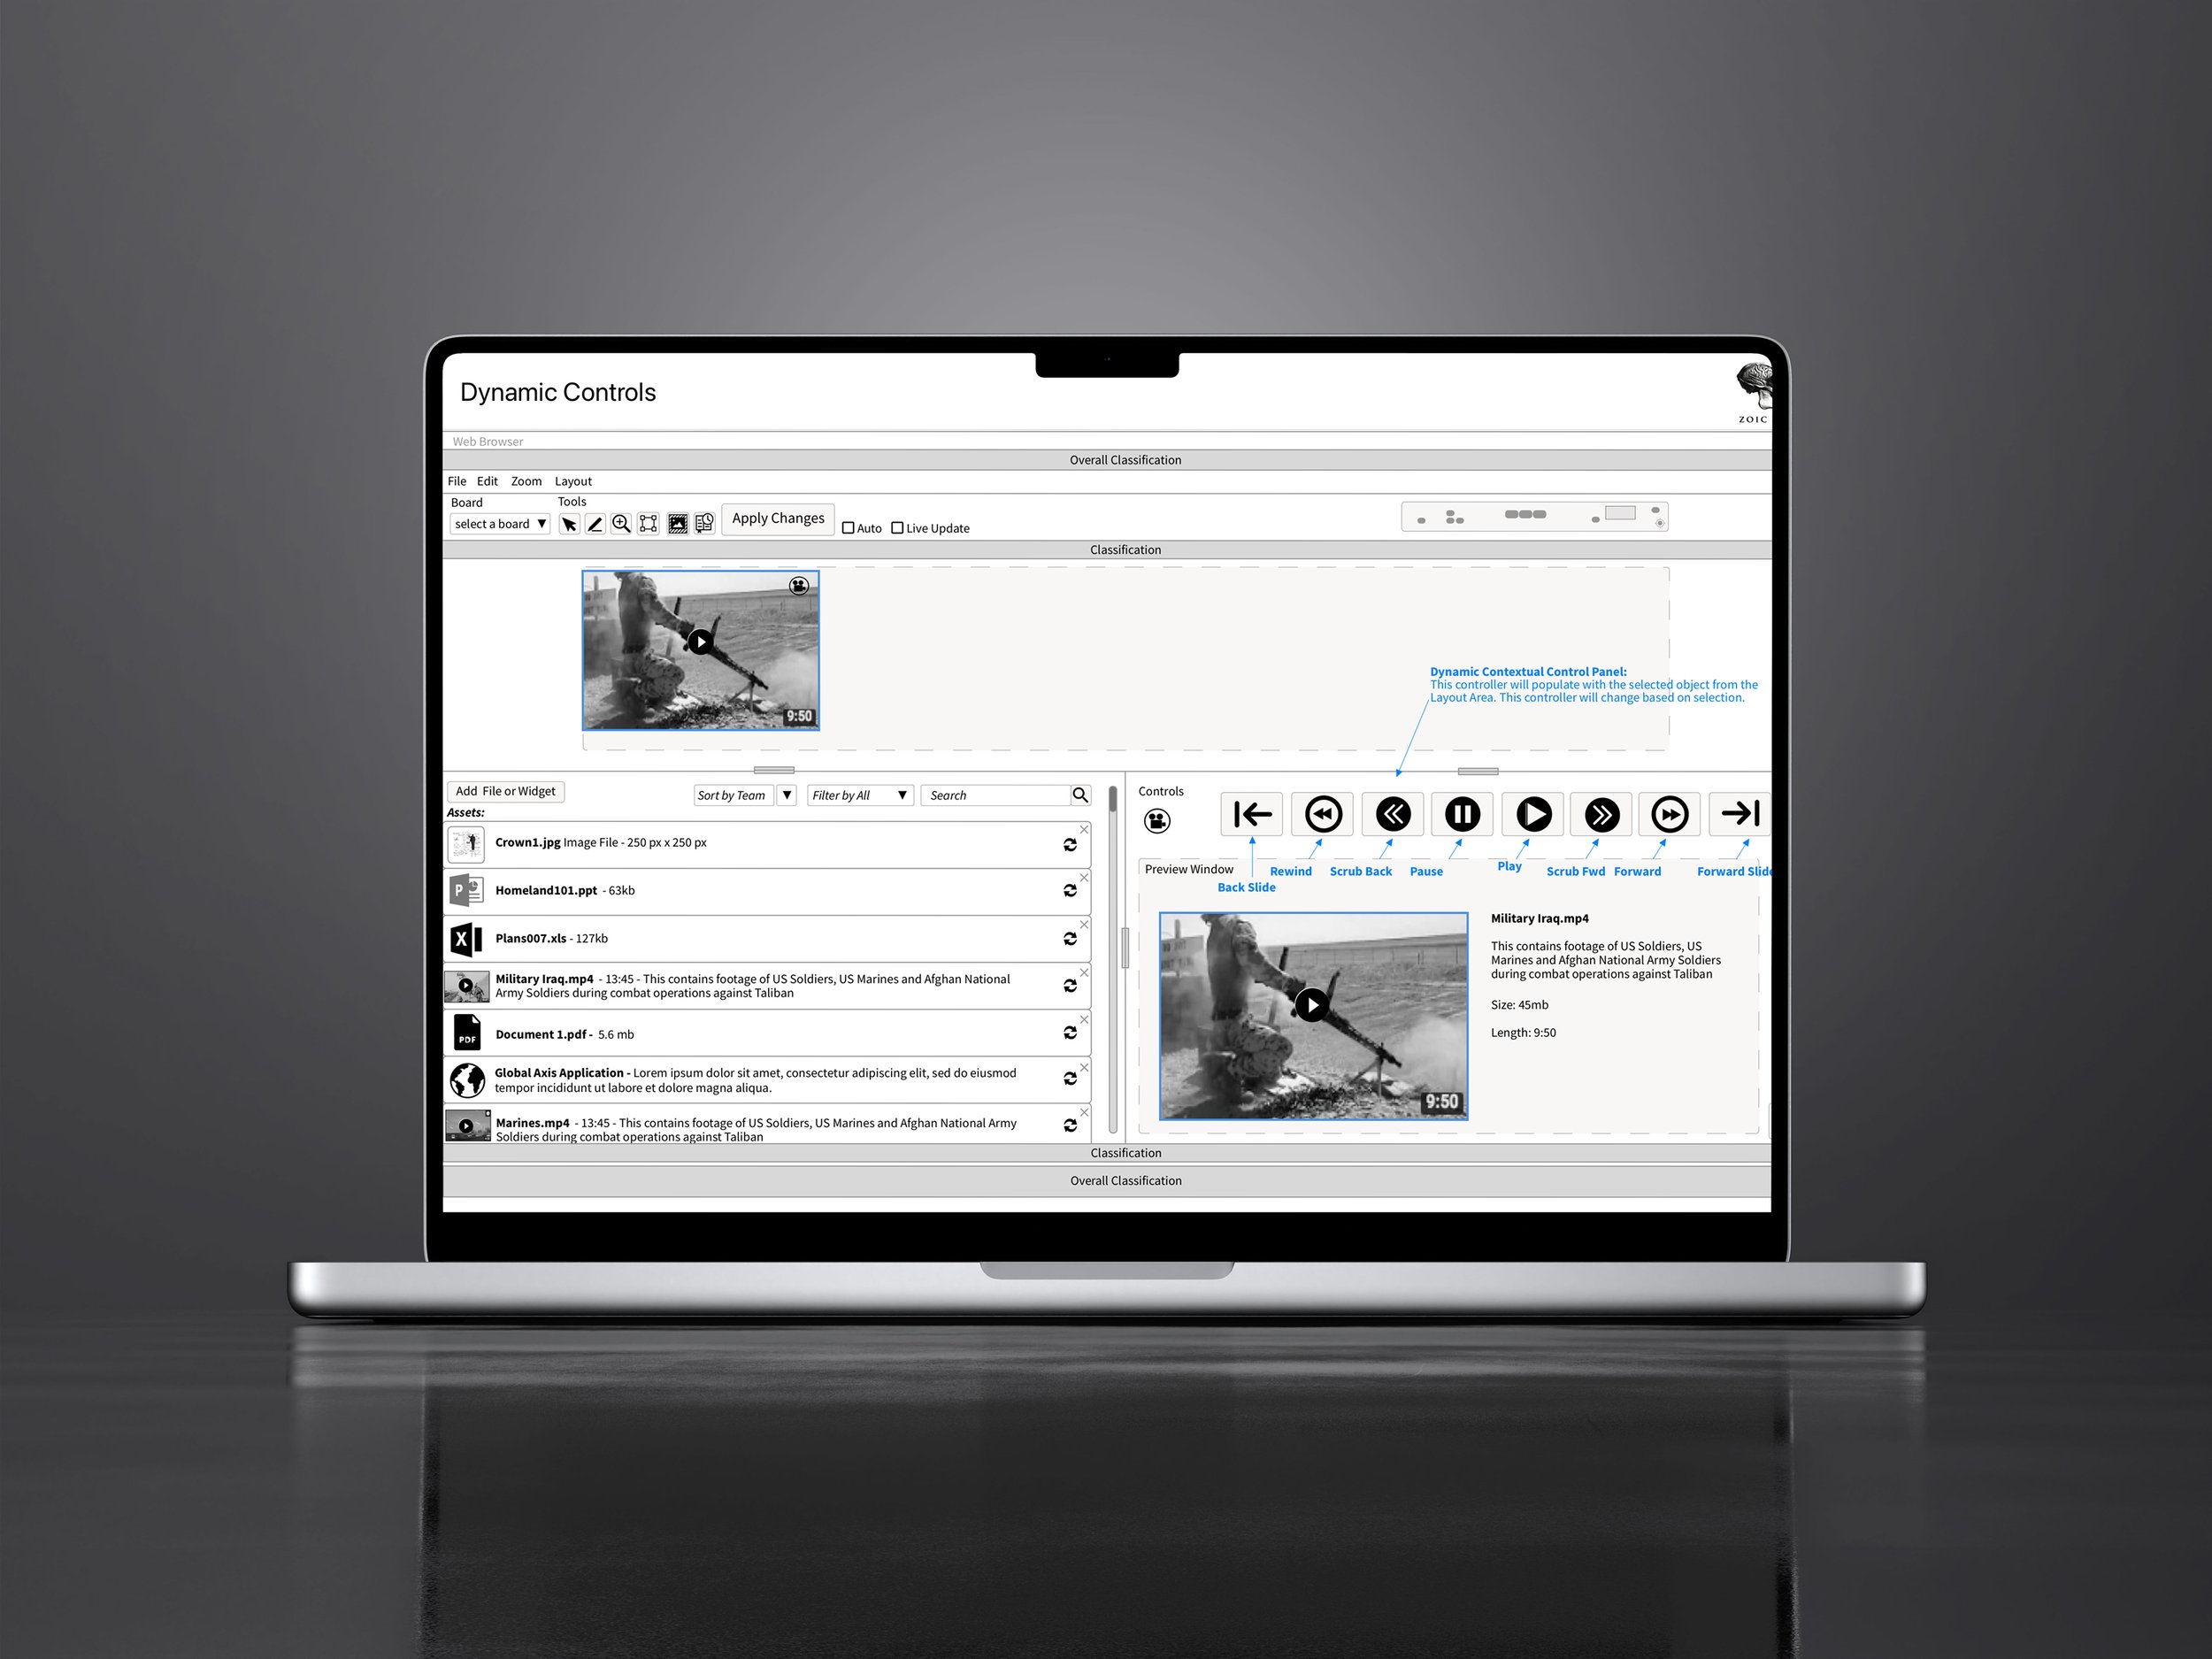
Controls Section
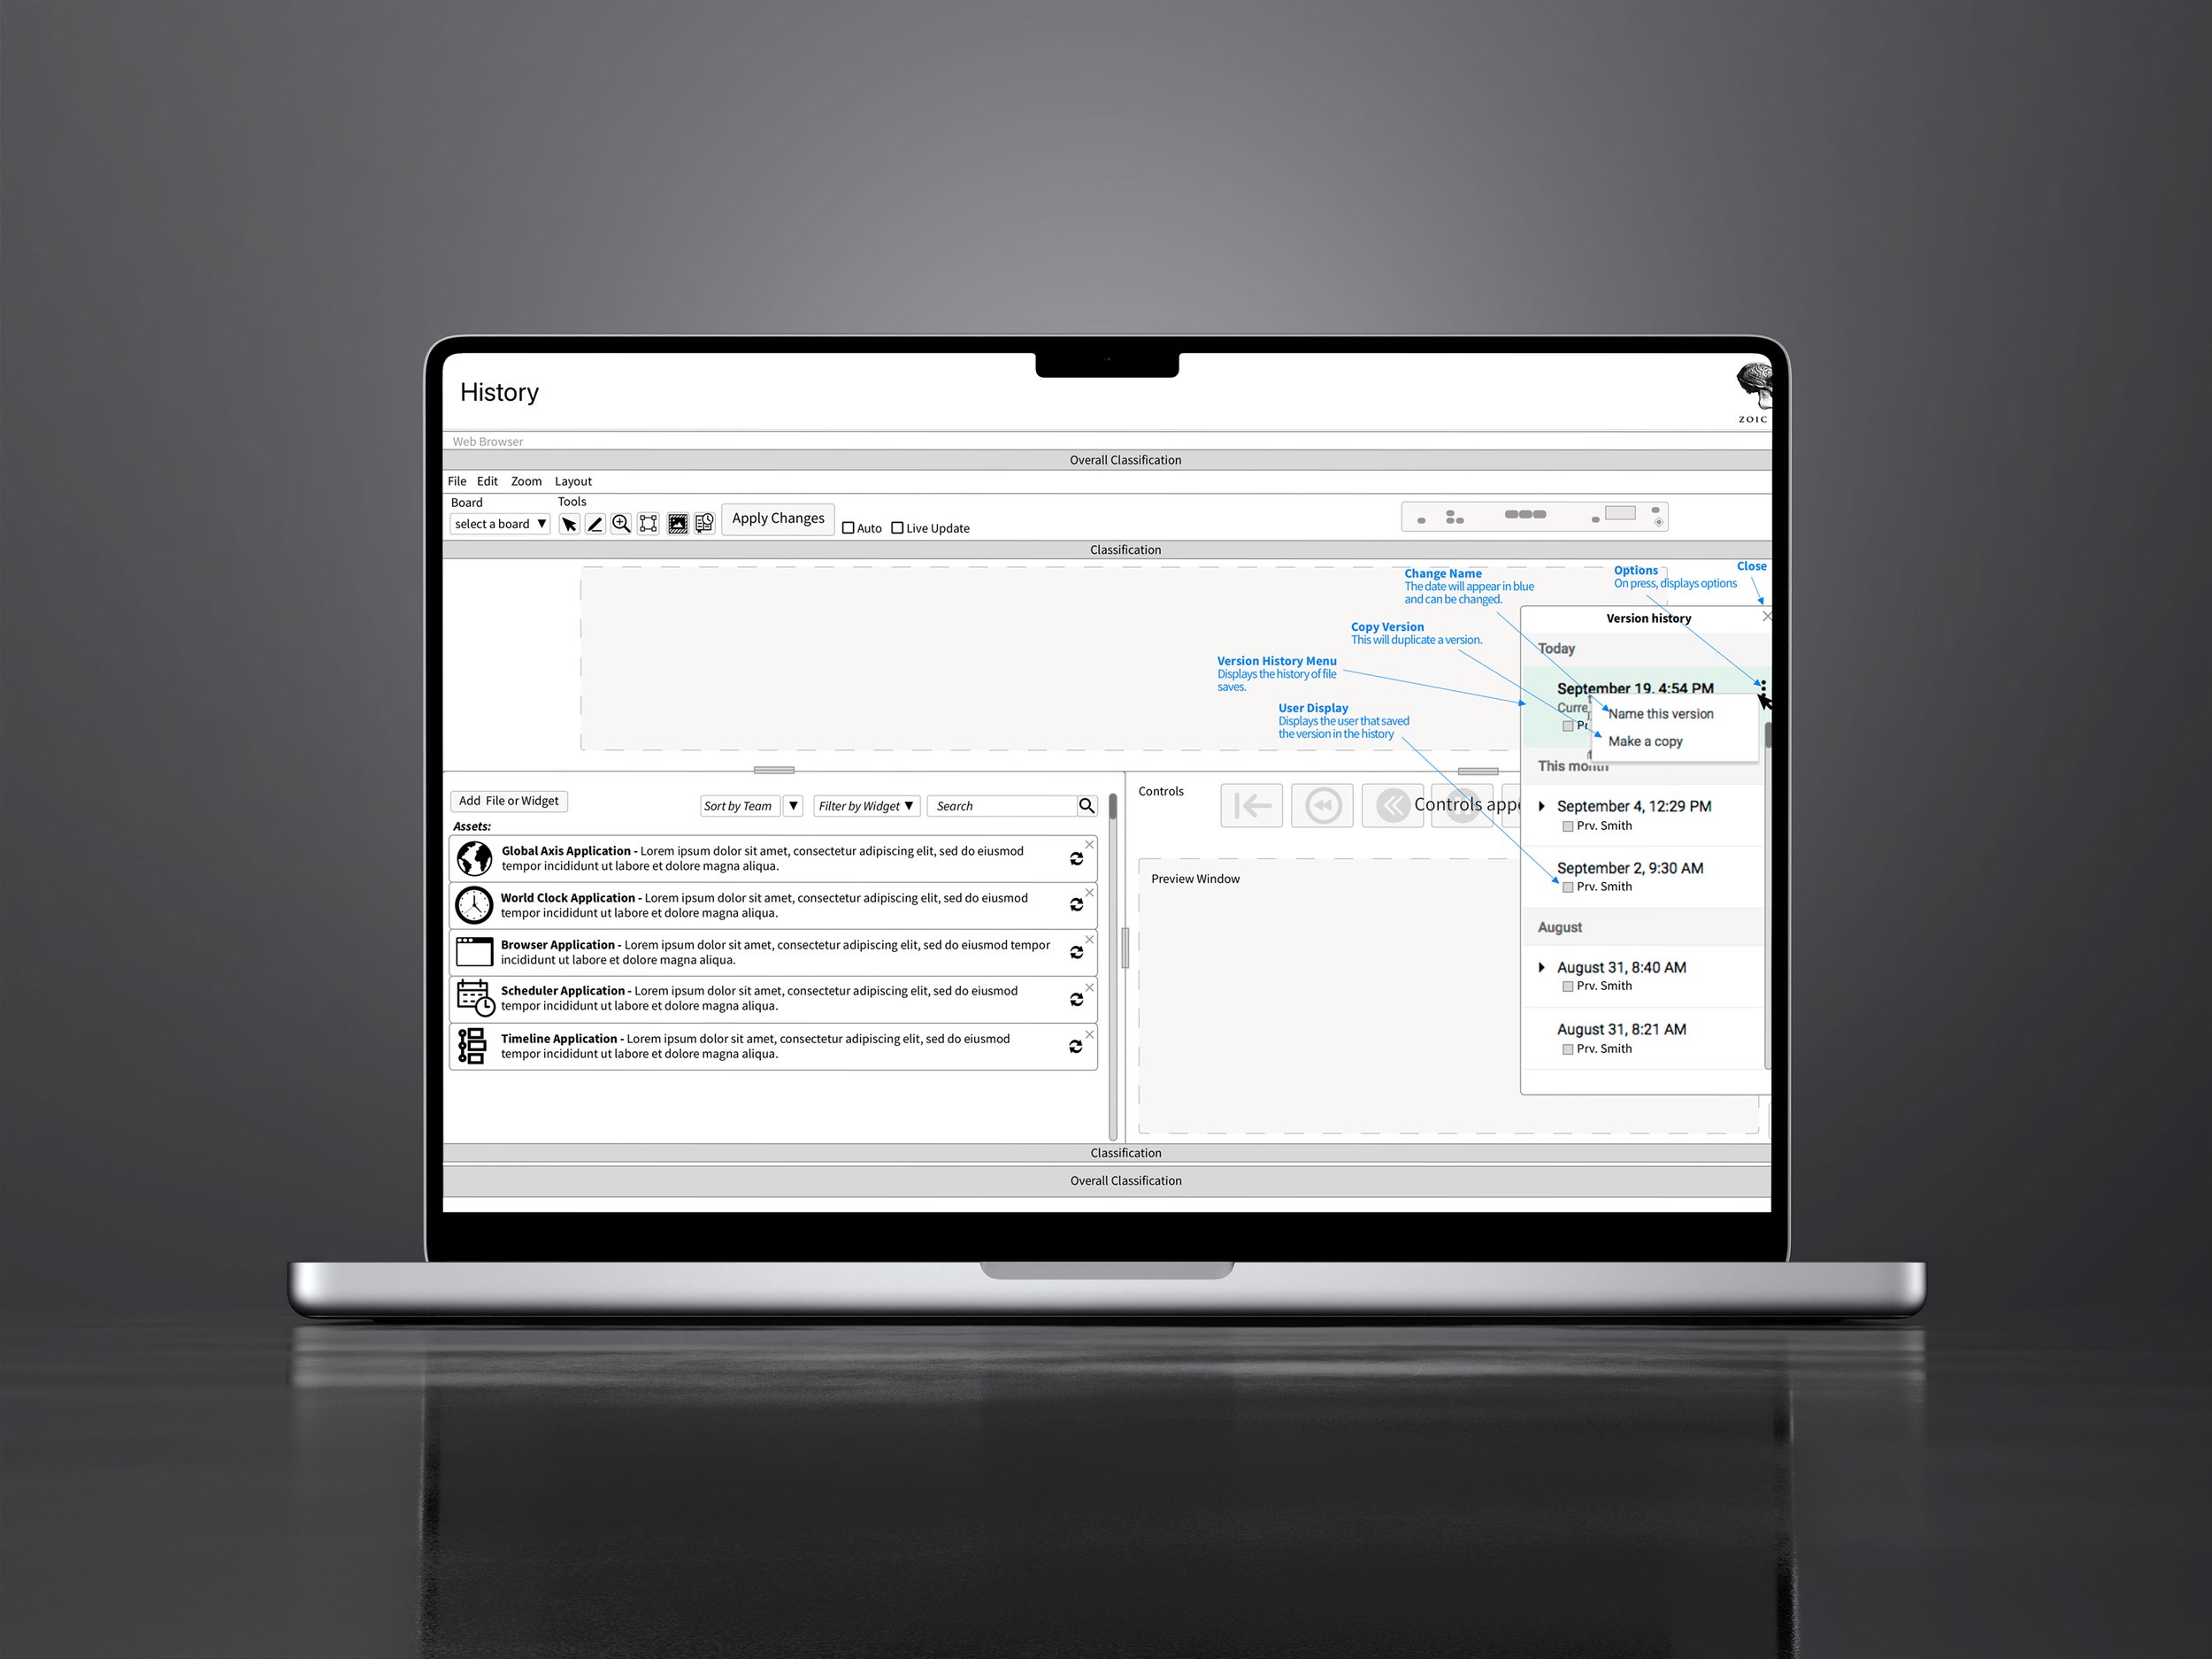
History - Recall Drawer
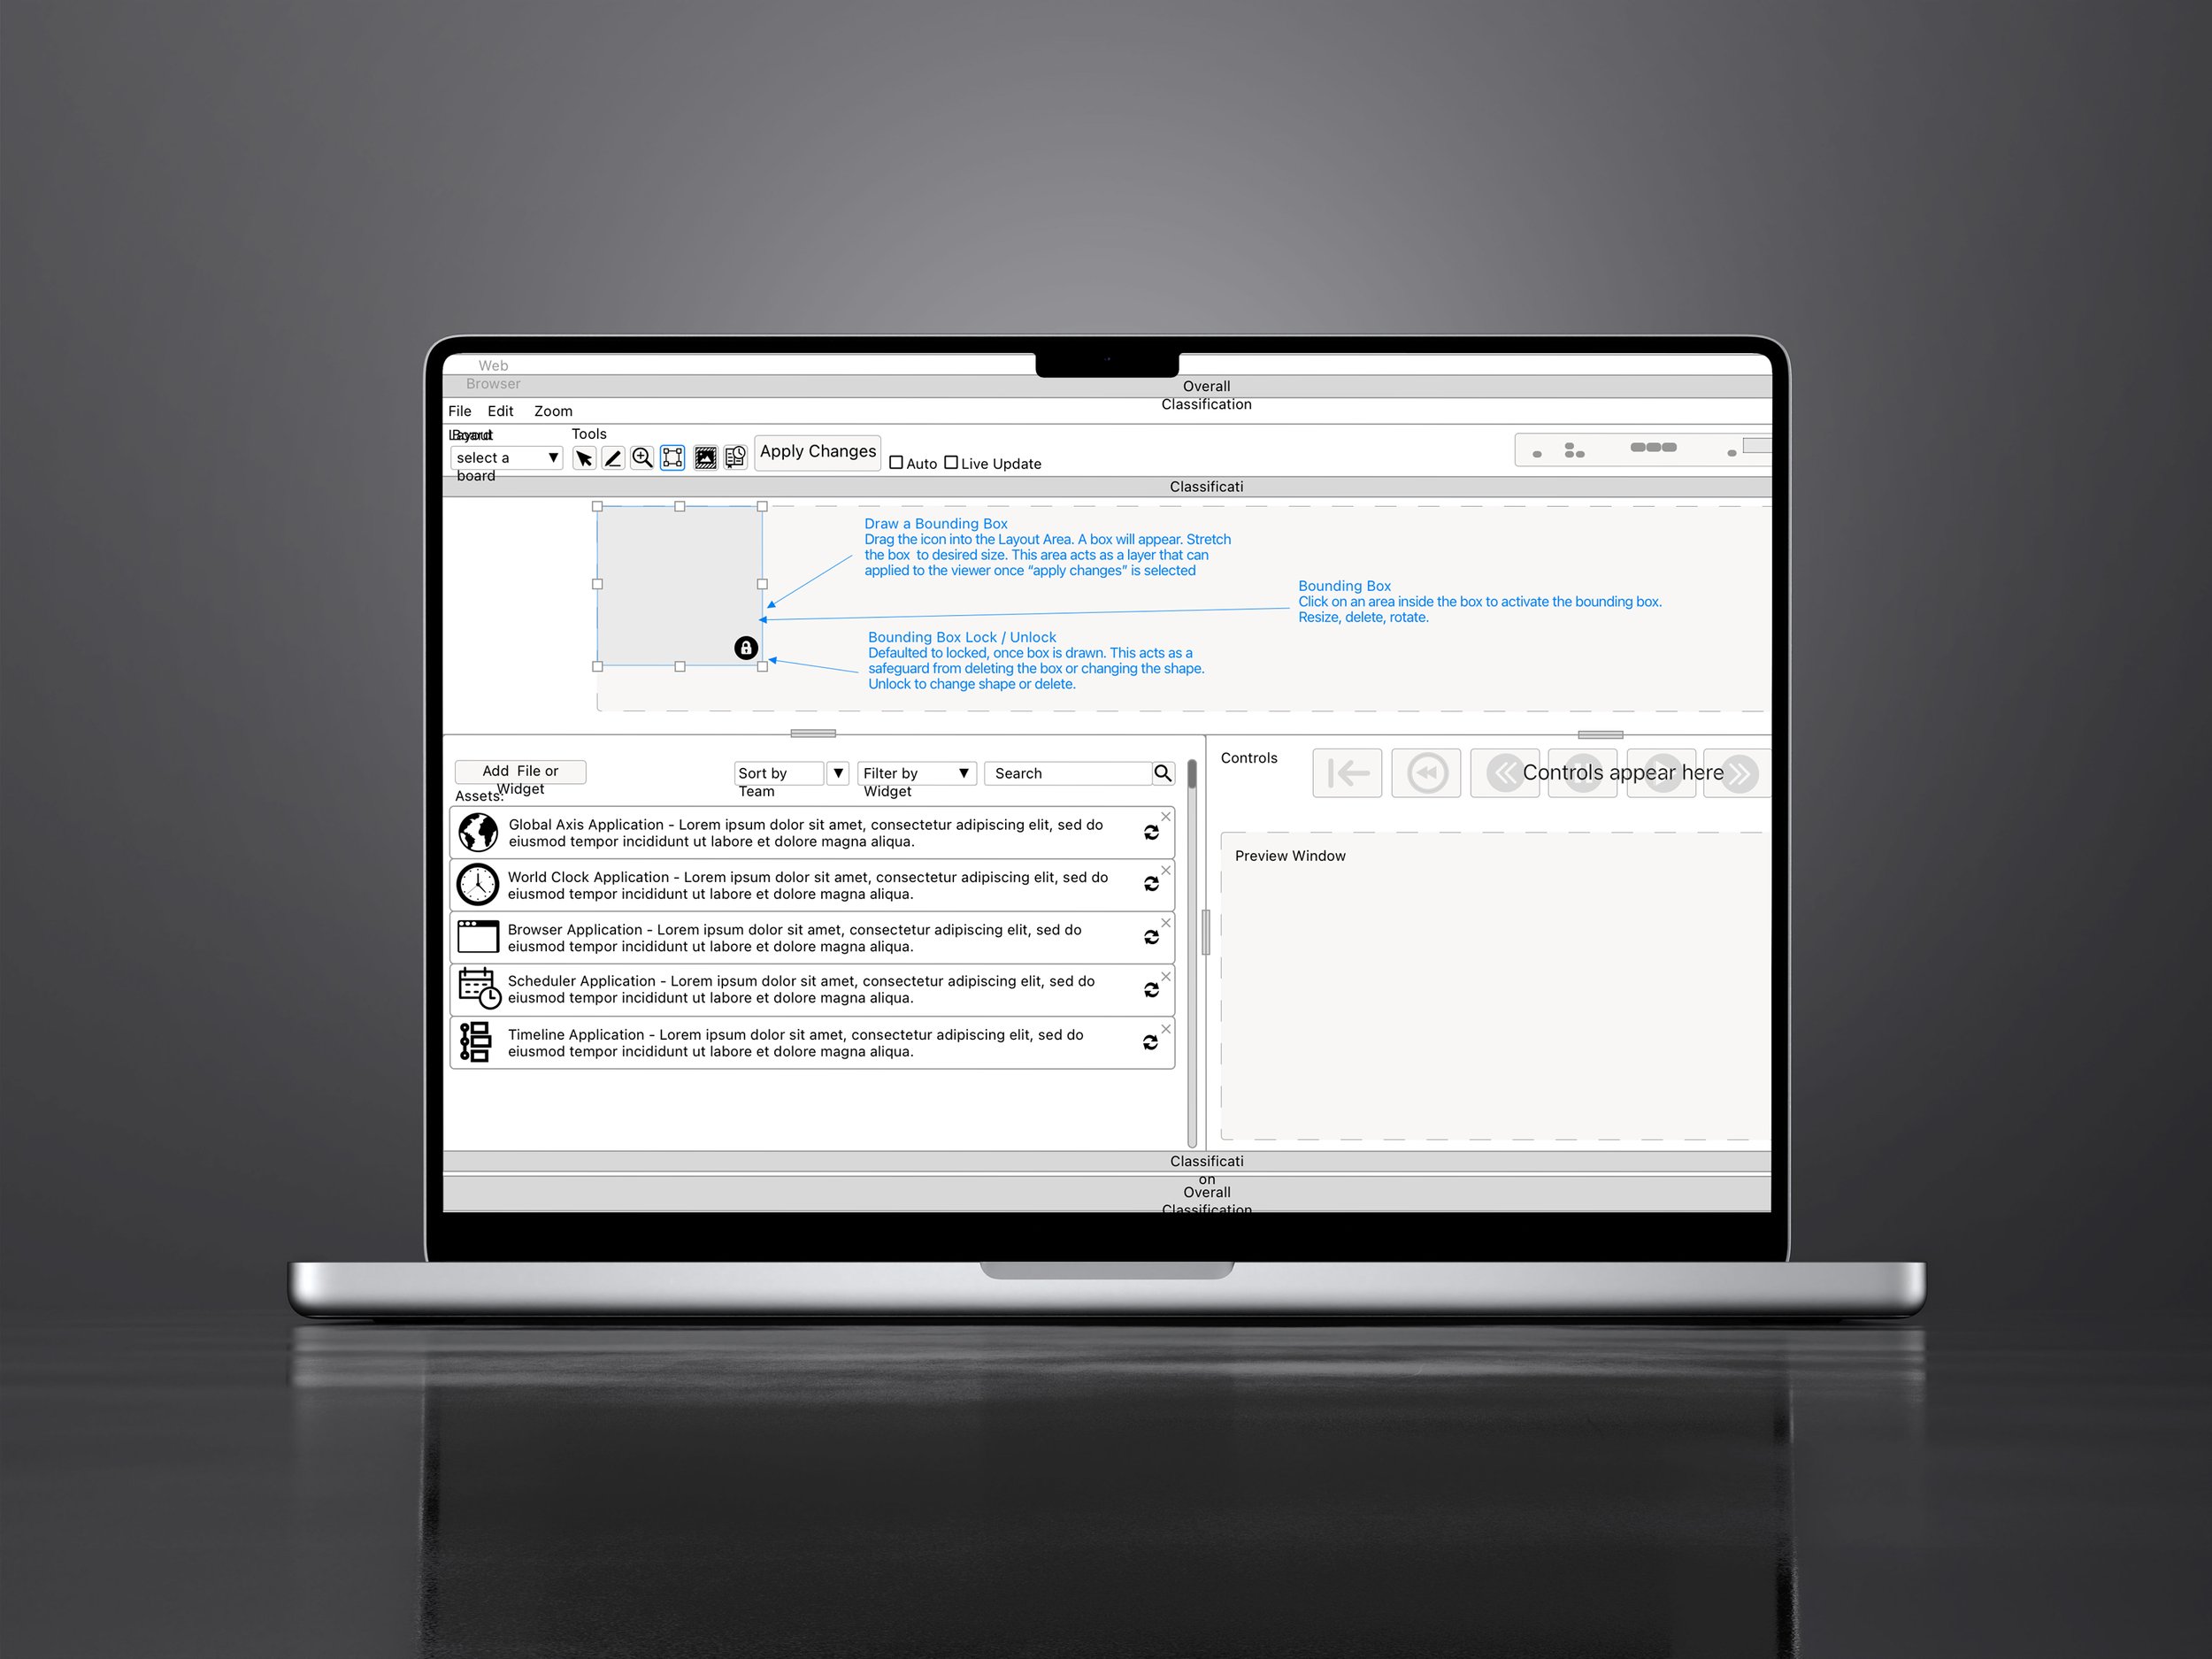
Bounding Box - Draw a box to add an element
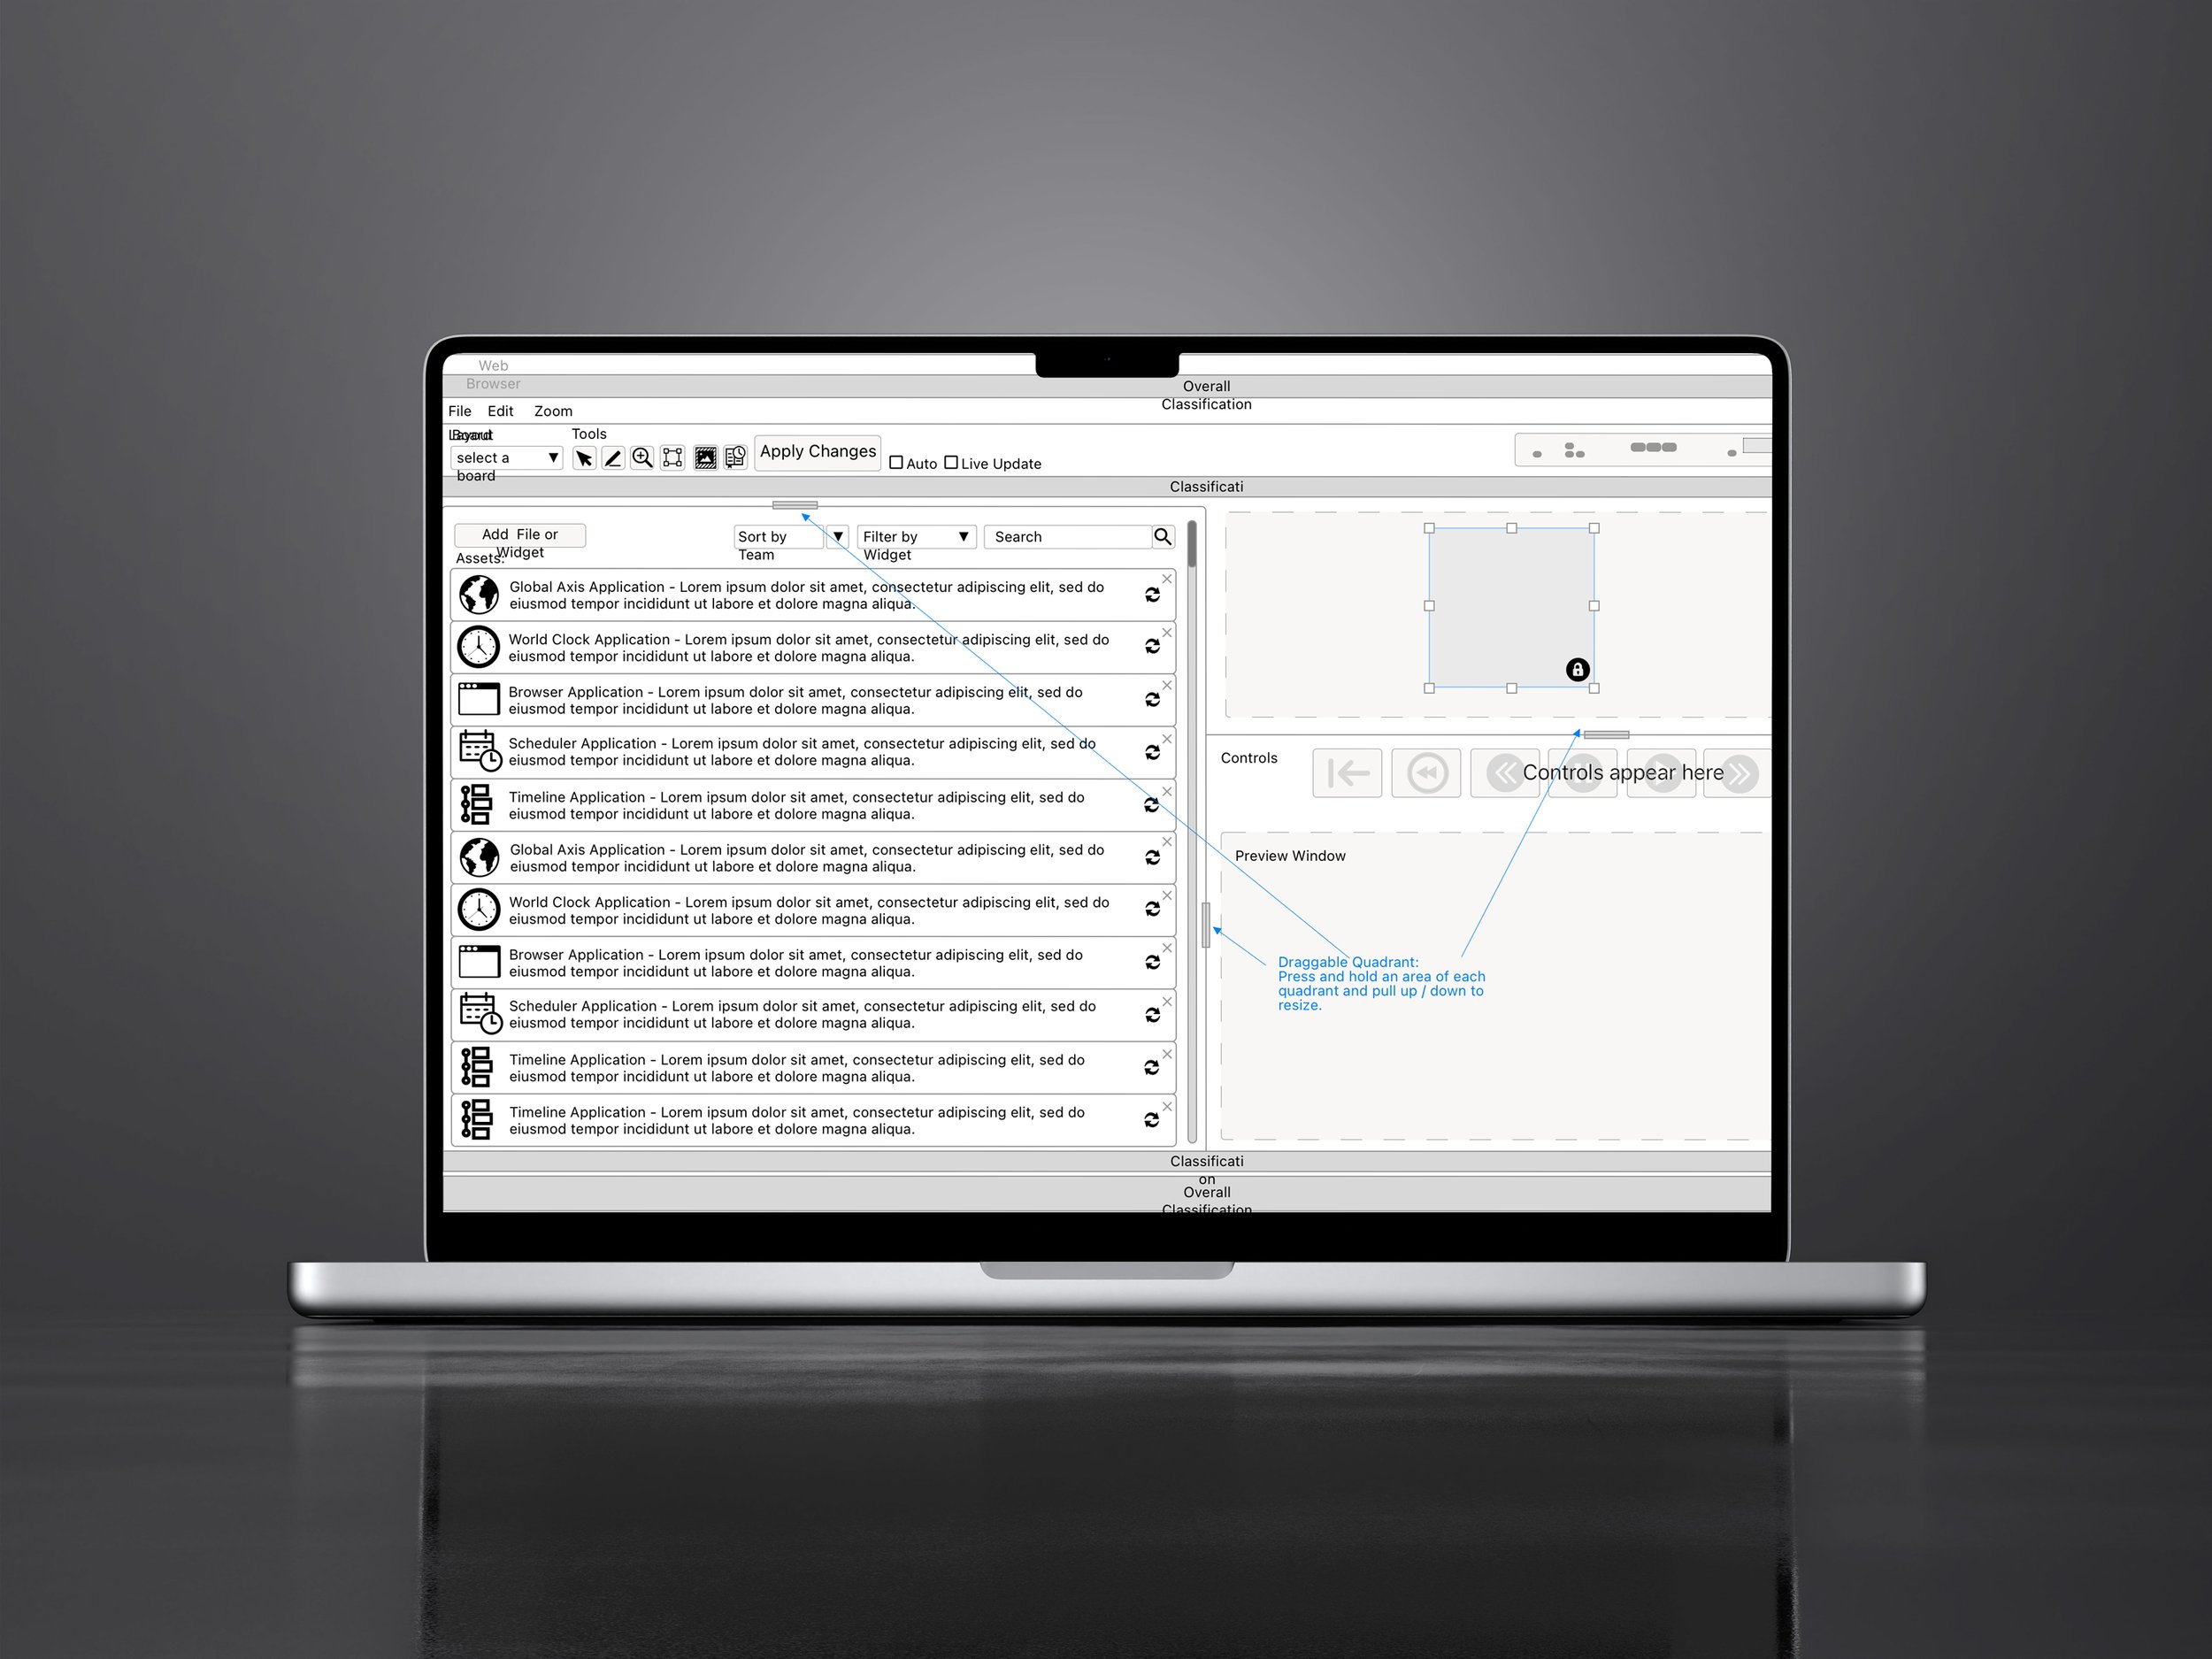
Draggable Quadrants
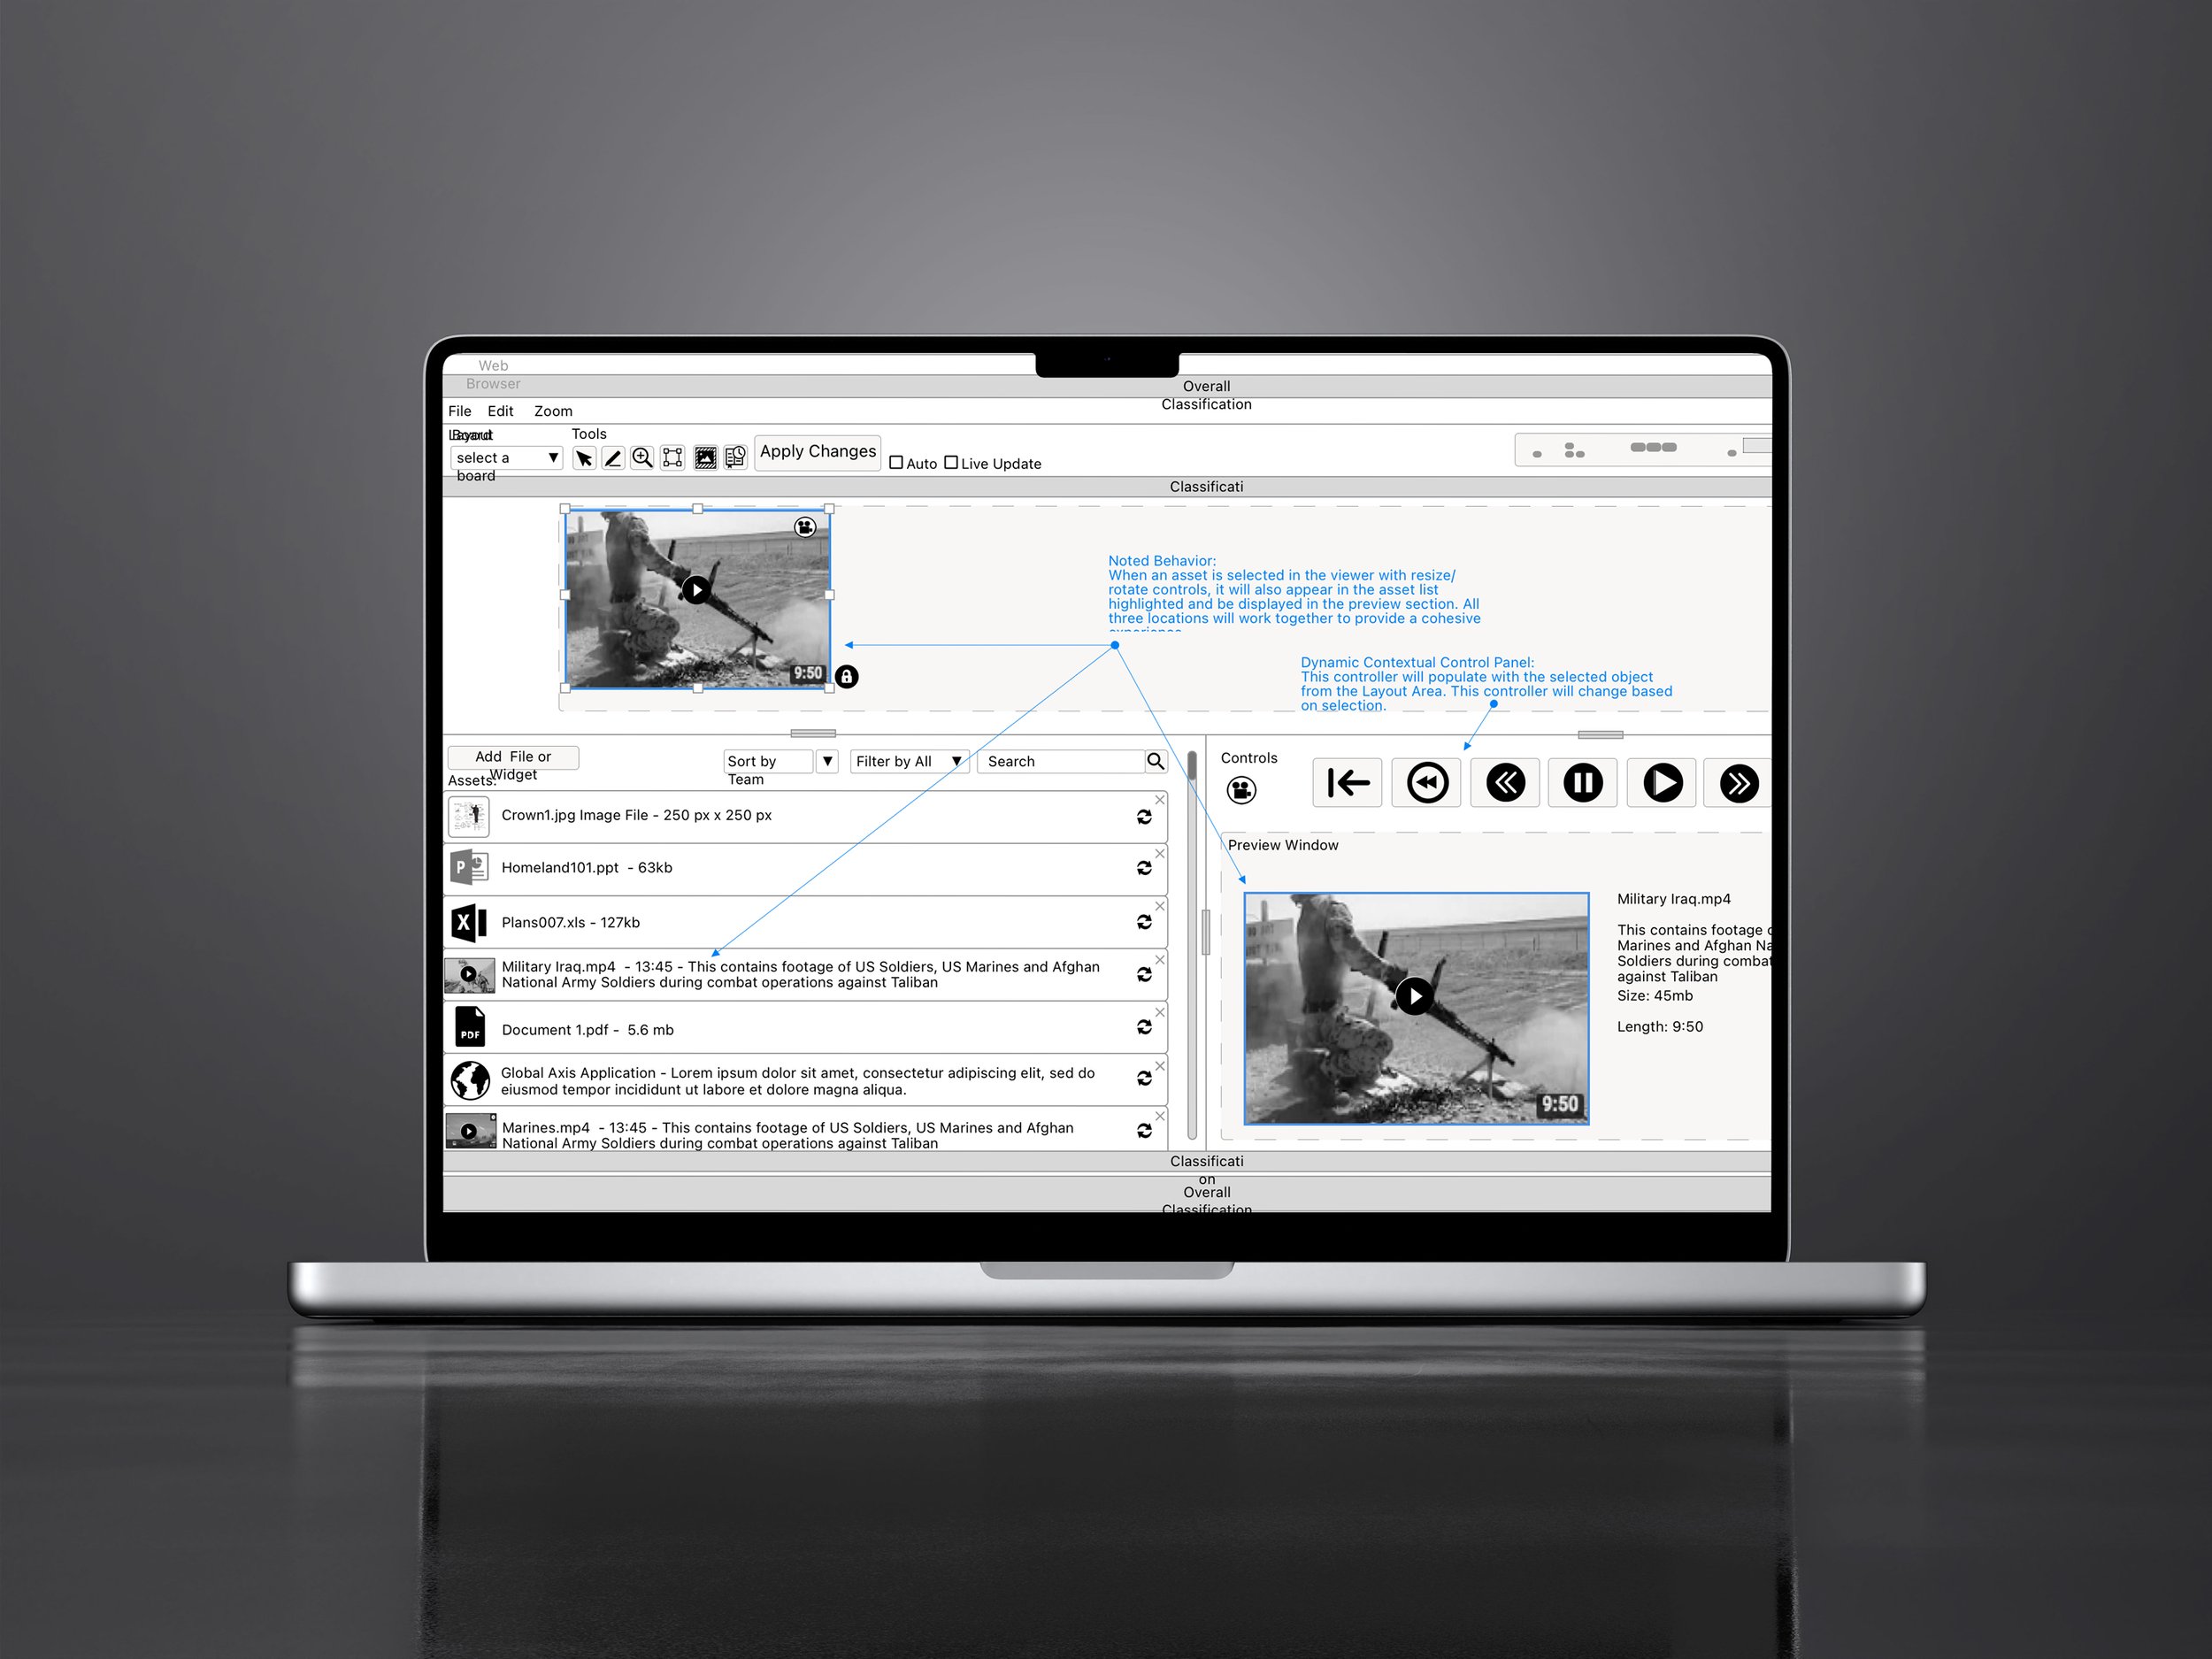
Dynamic Behavior
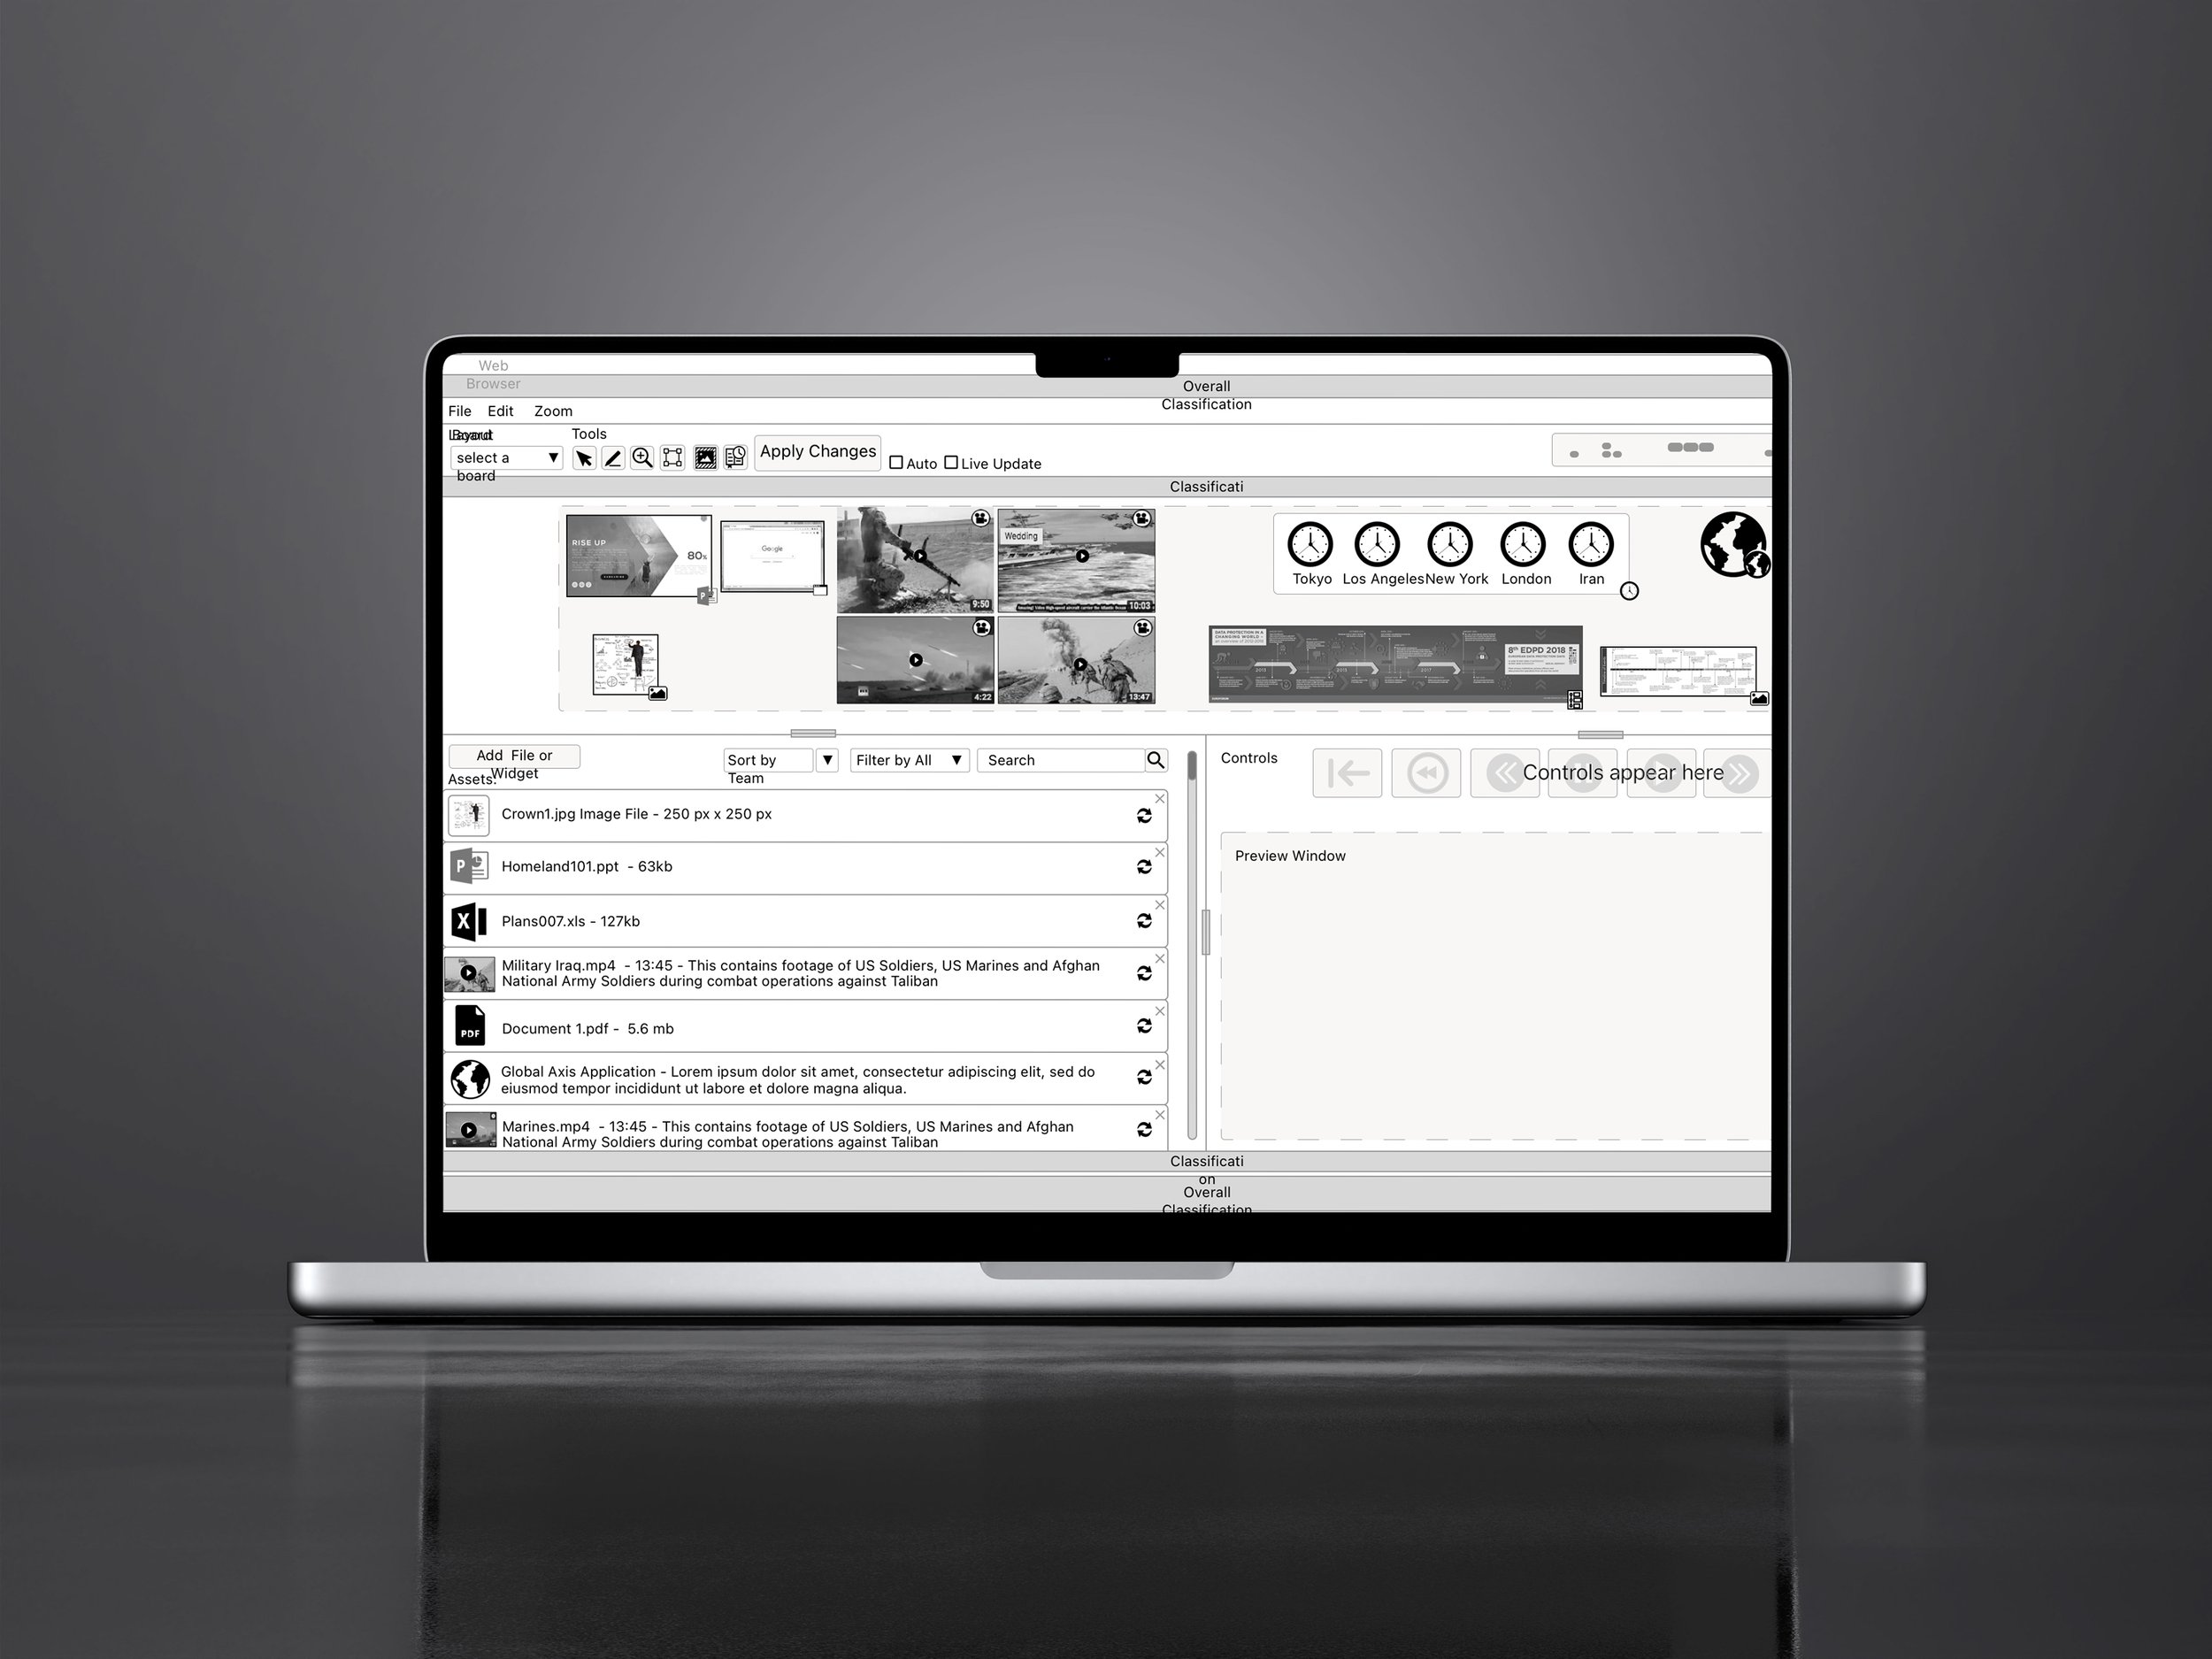
End Result
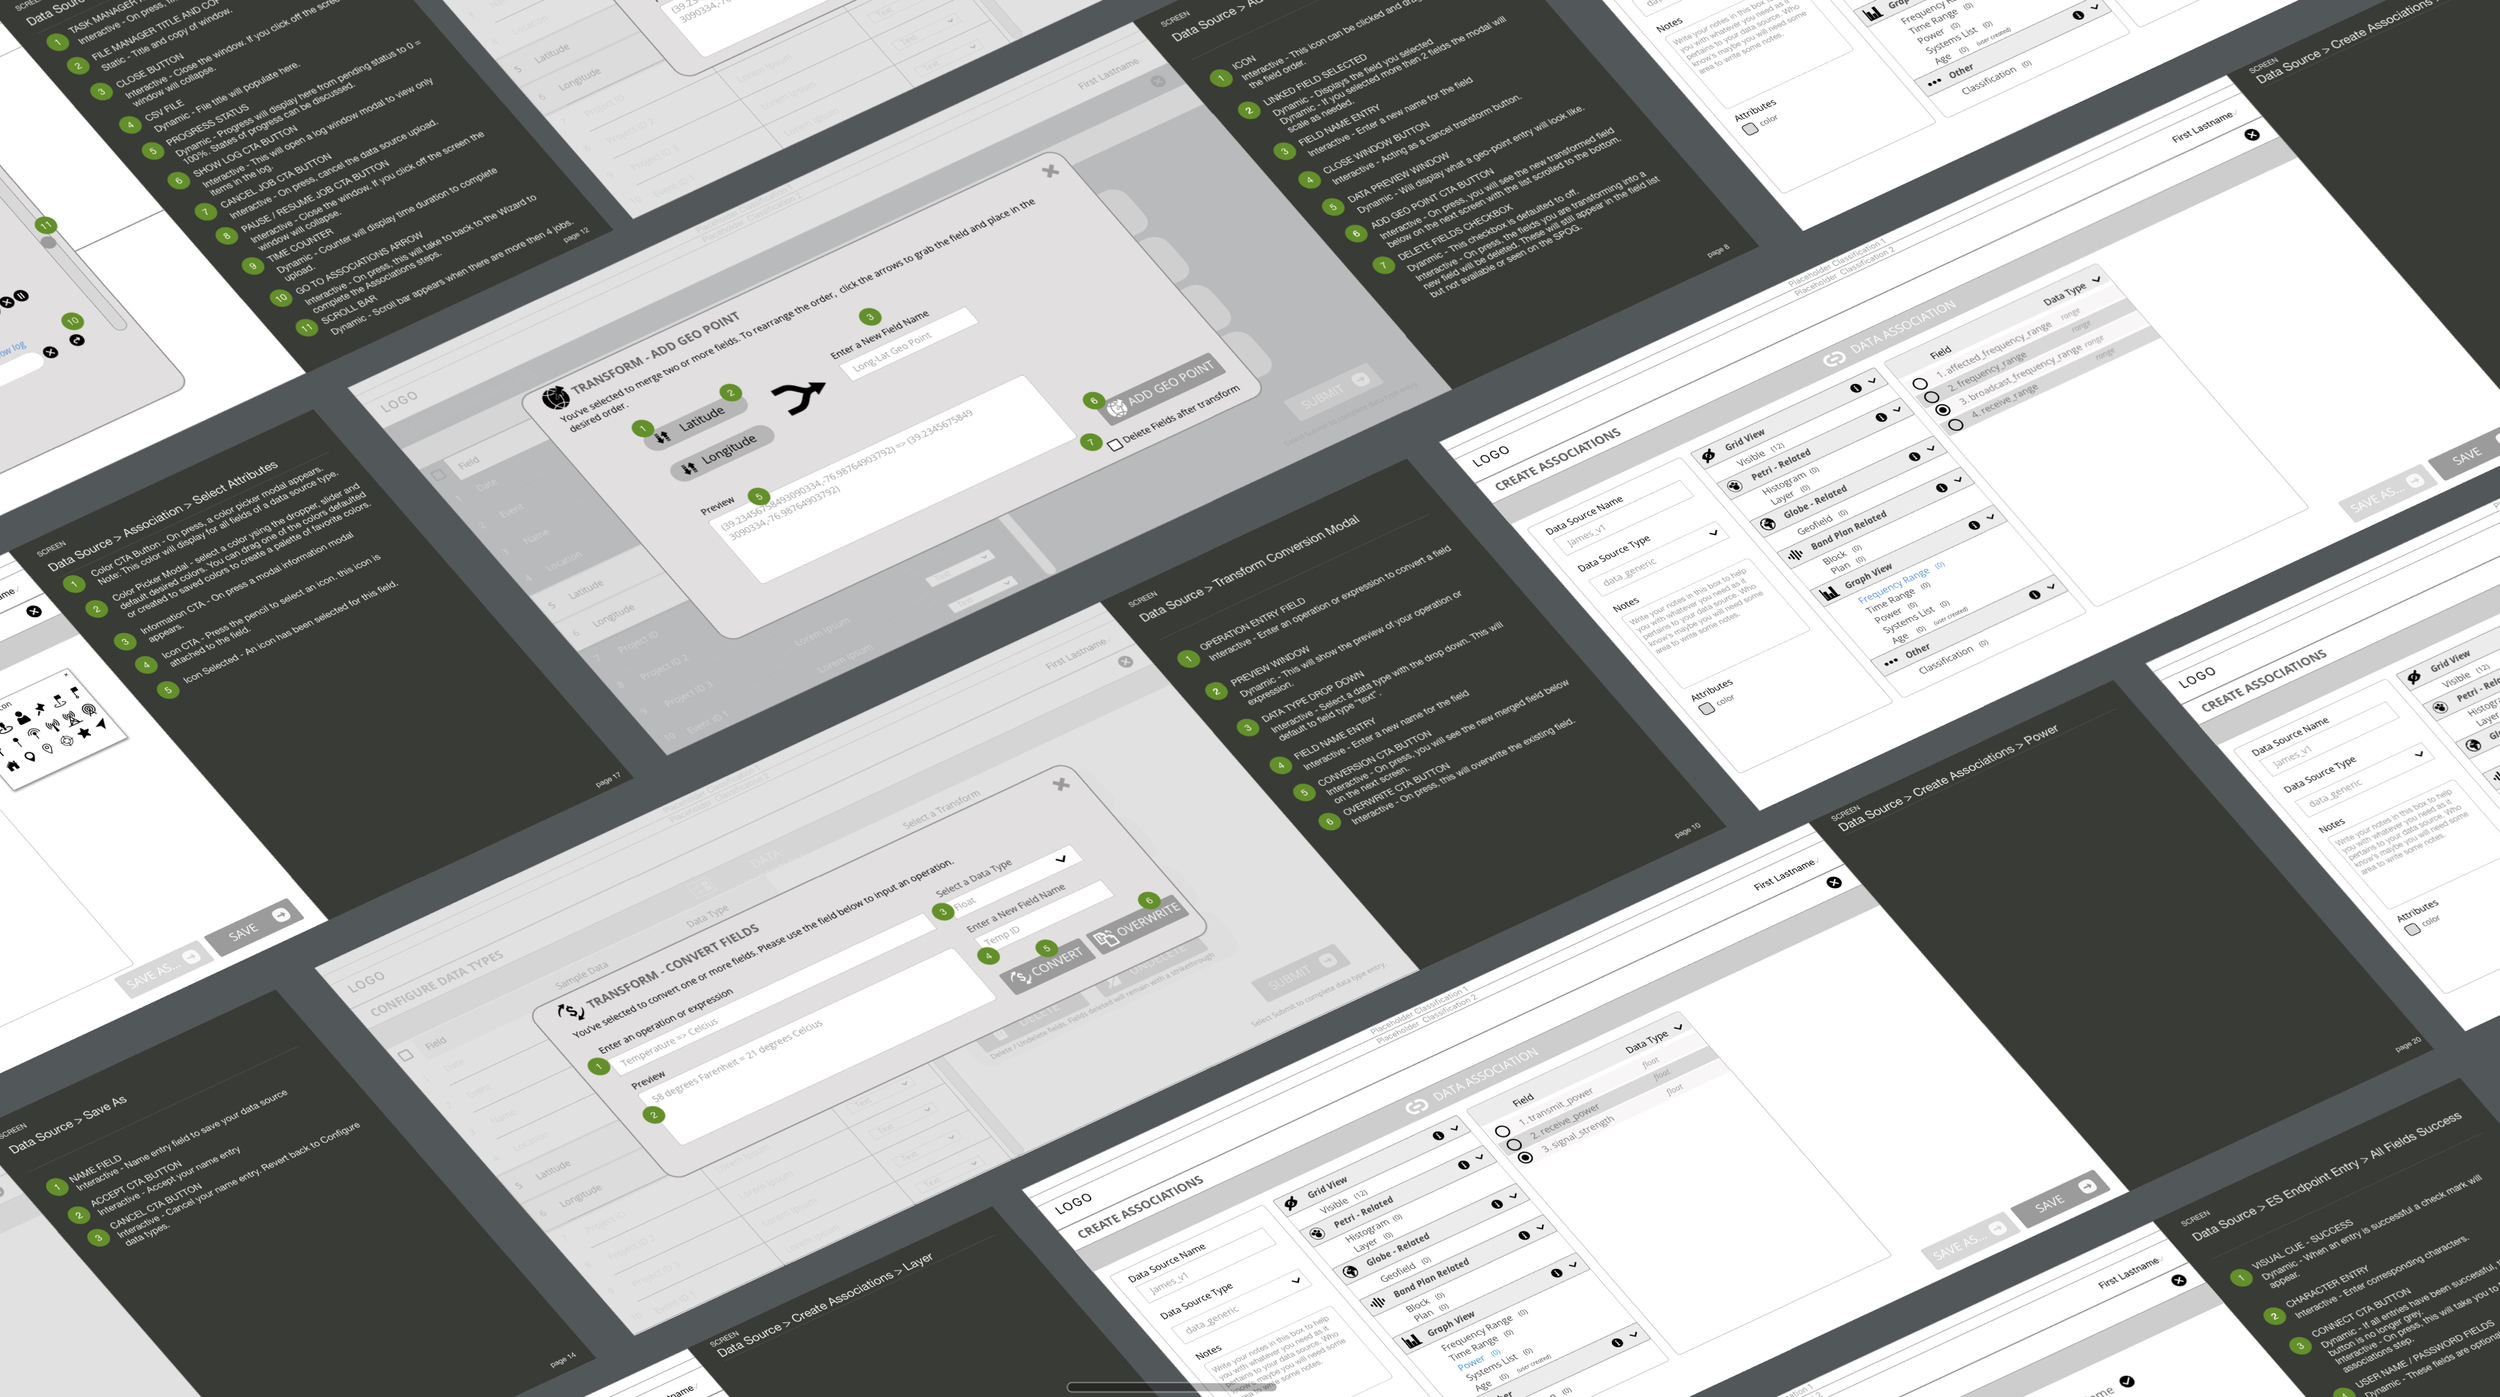
At ZoicLabs, which aimed to merge Zoic Studios' special effects expertise with advanced data visualization, I was hired to develop diverse user interfaces for collecting, separating, and displaying data-rich visuals. This involved creating tools to input, map, and template data from various sources for enhanced visualization.
As pioneers in data visualization, we developed early wireframes to obtain geo-spatial data and longitude/latitude coordinates for tracking space debris and other objects. This UI offered flexible data source integration, enabling users to accurately select and visualize their desired data. Below you can see these wireframes and annotations to understand the complexity.

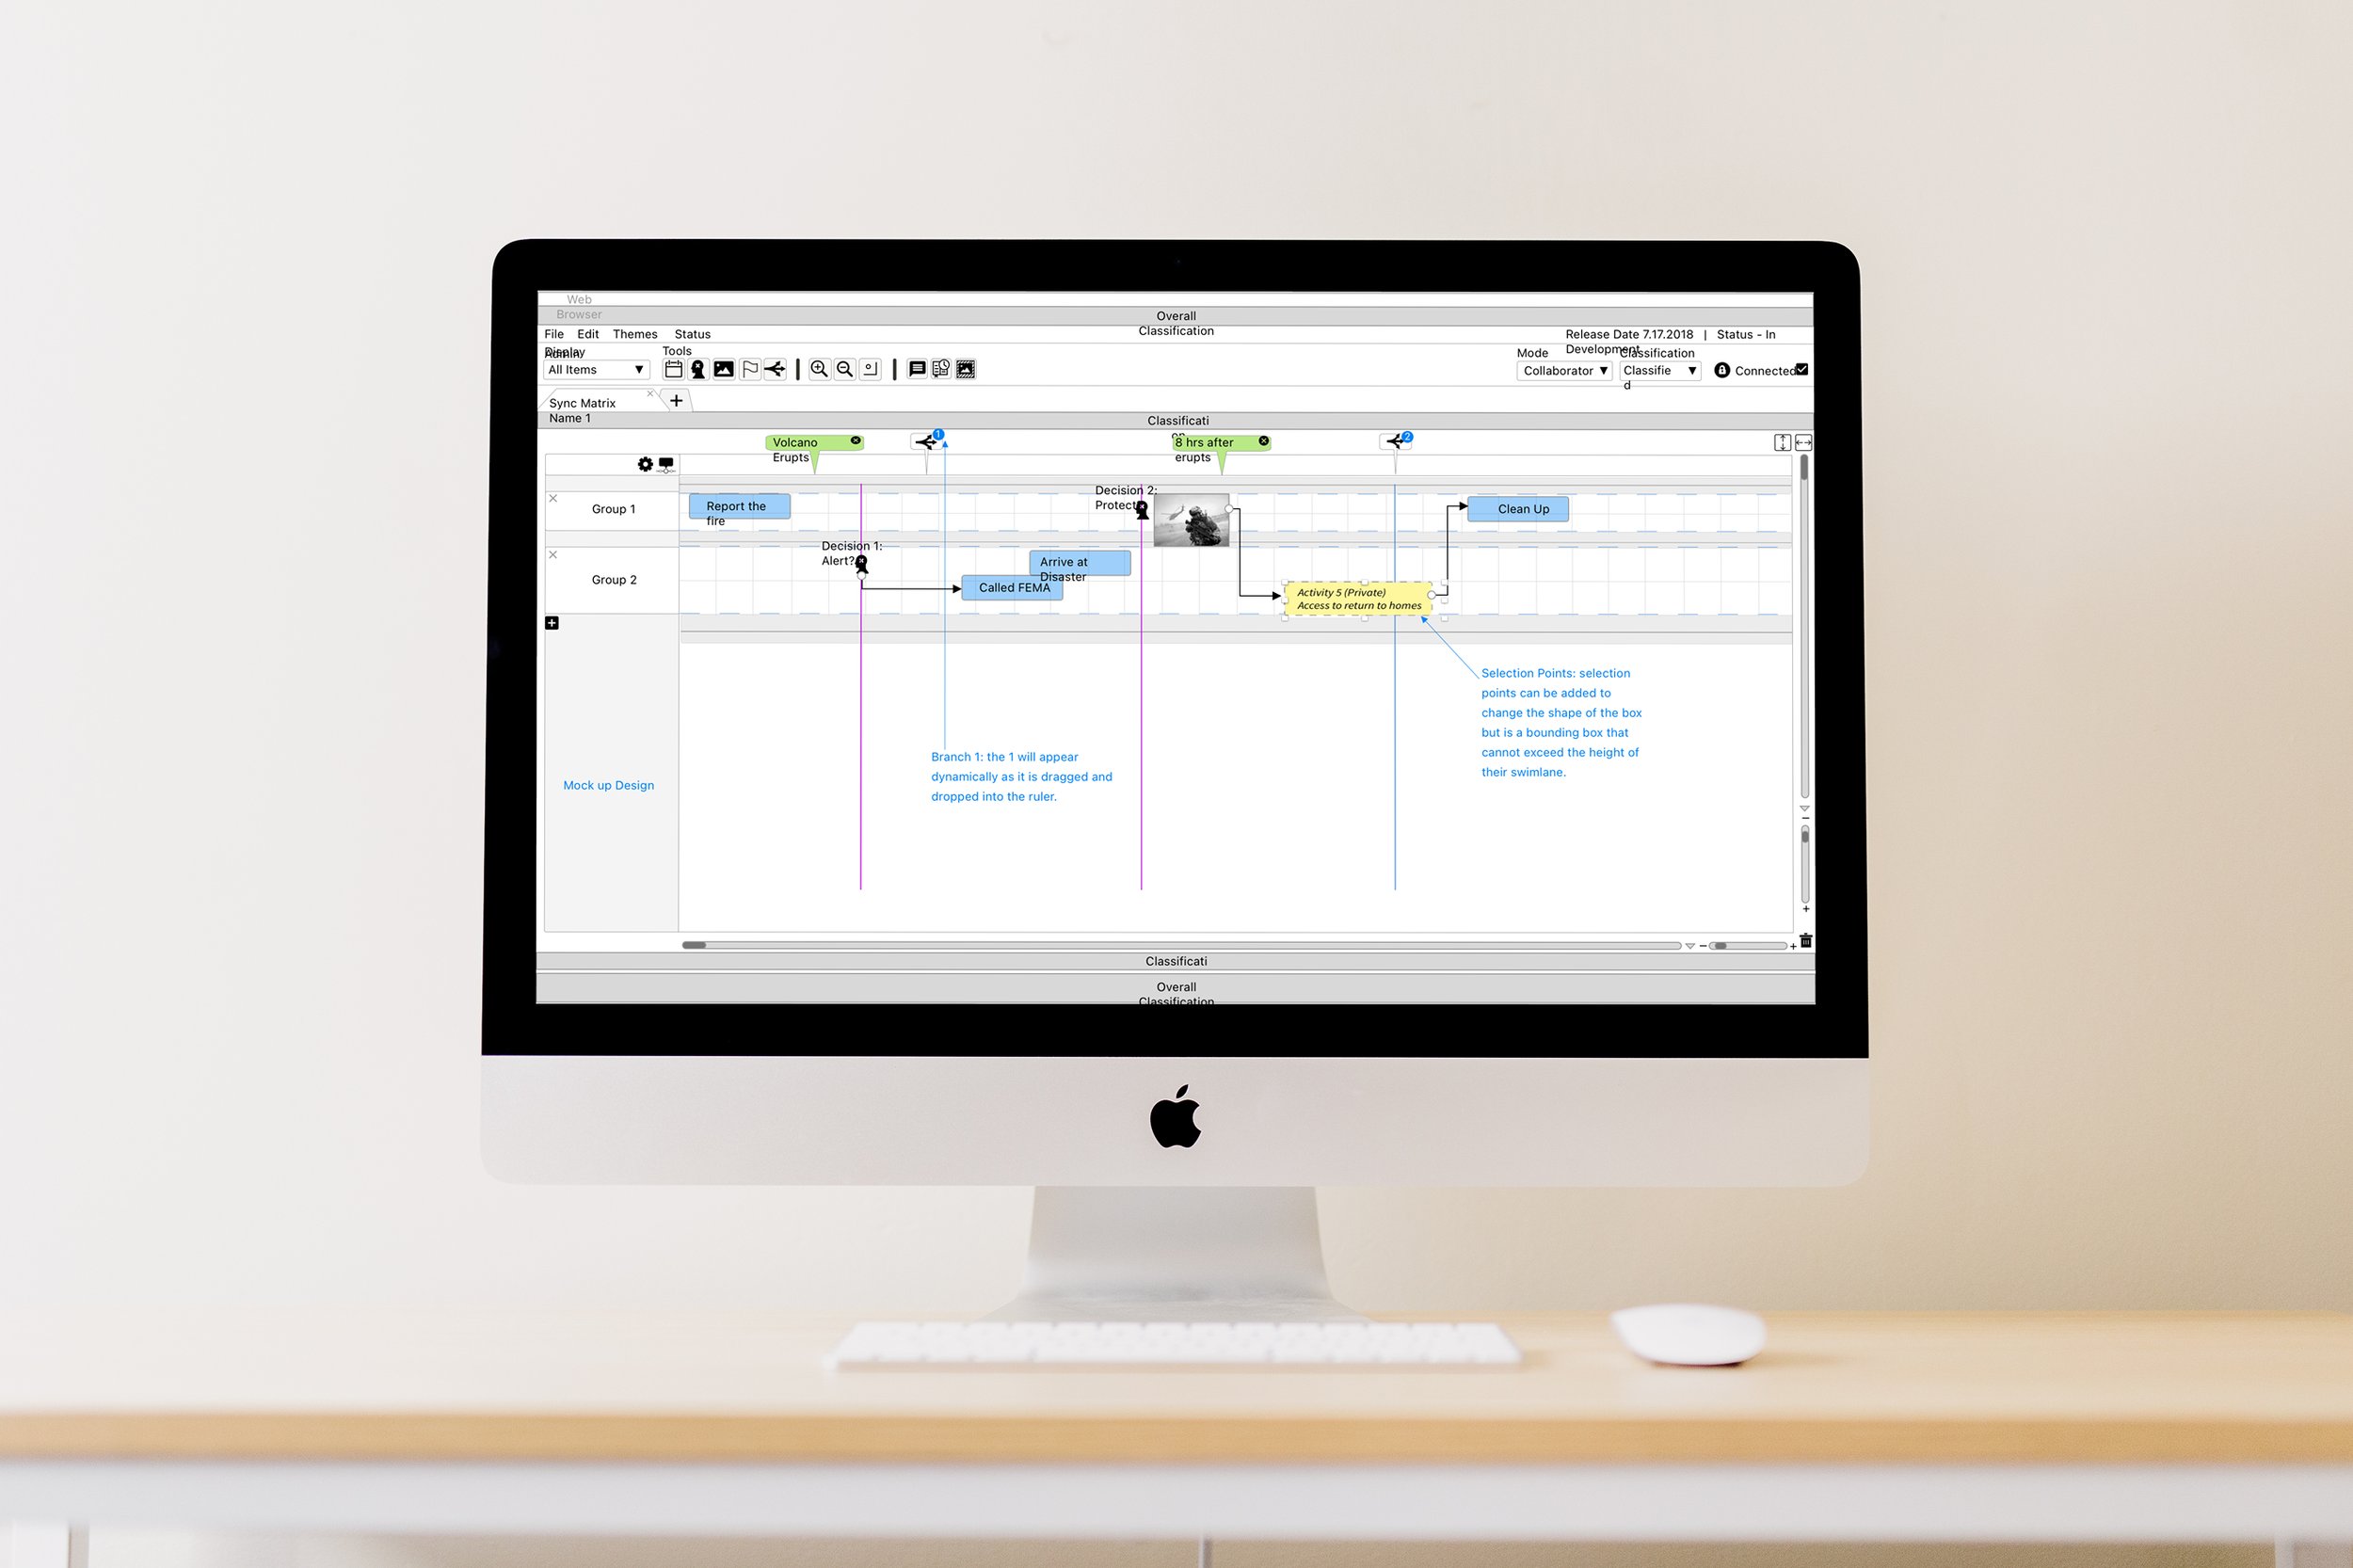
Zoic Labs was contracted to develop several high-level concepts for government projects, including a Crisis Management SaaS Tool. This tool was designed to alert various parties and emergency teams, enabling them to converge on solutions to resolve critical situations.
The wireframes showcase a UI that integrates multiple users accessing the same interface to determine various outcomes. Through several sessions with visionary clients, I crafted an interface flexible enough to accommodate multiple timelines simultaneously, while allowing for the creation of multiple branches for alternate outcomes.
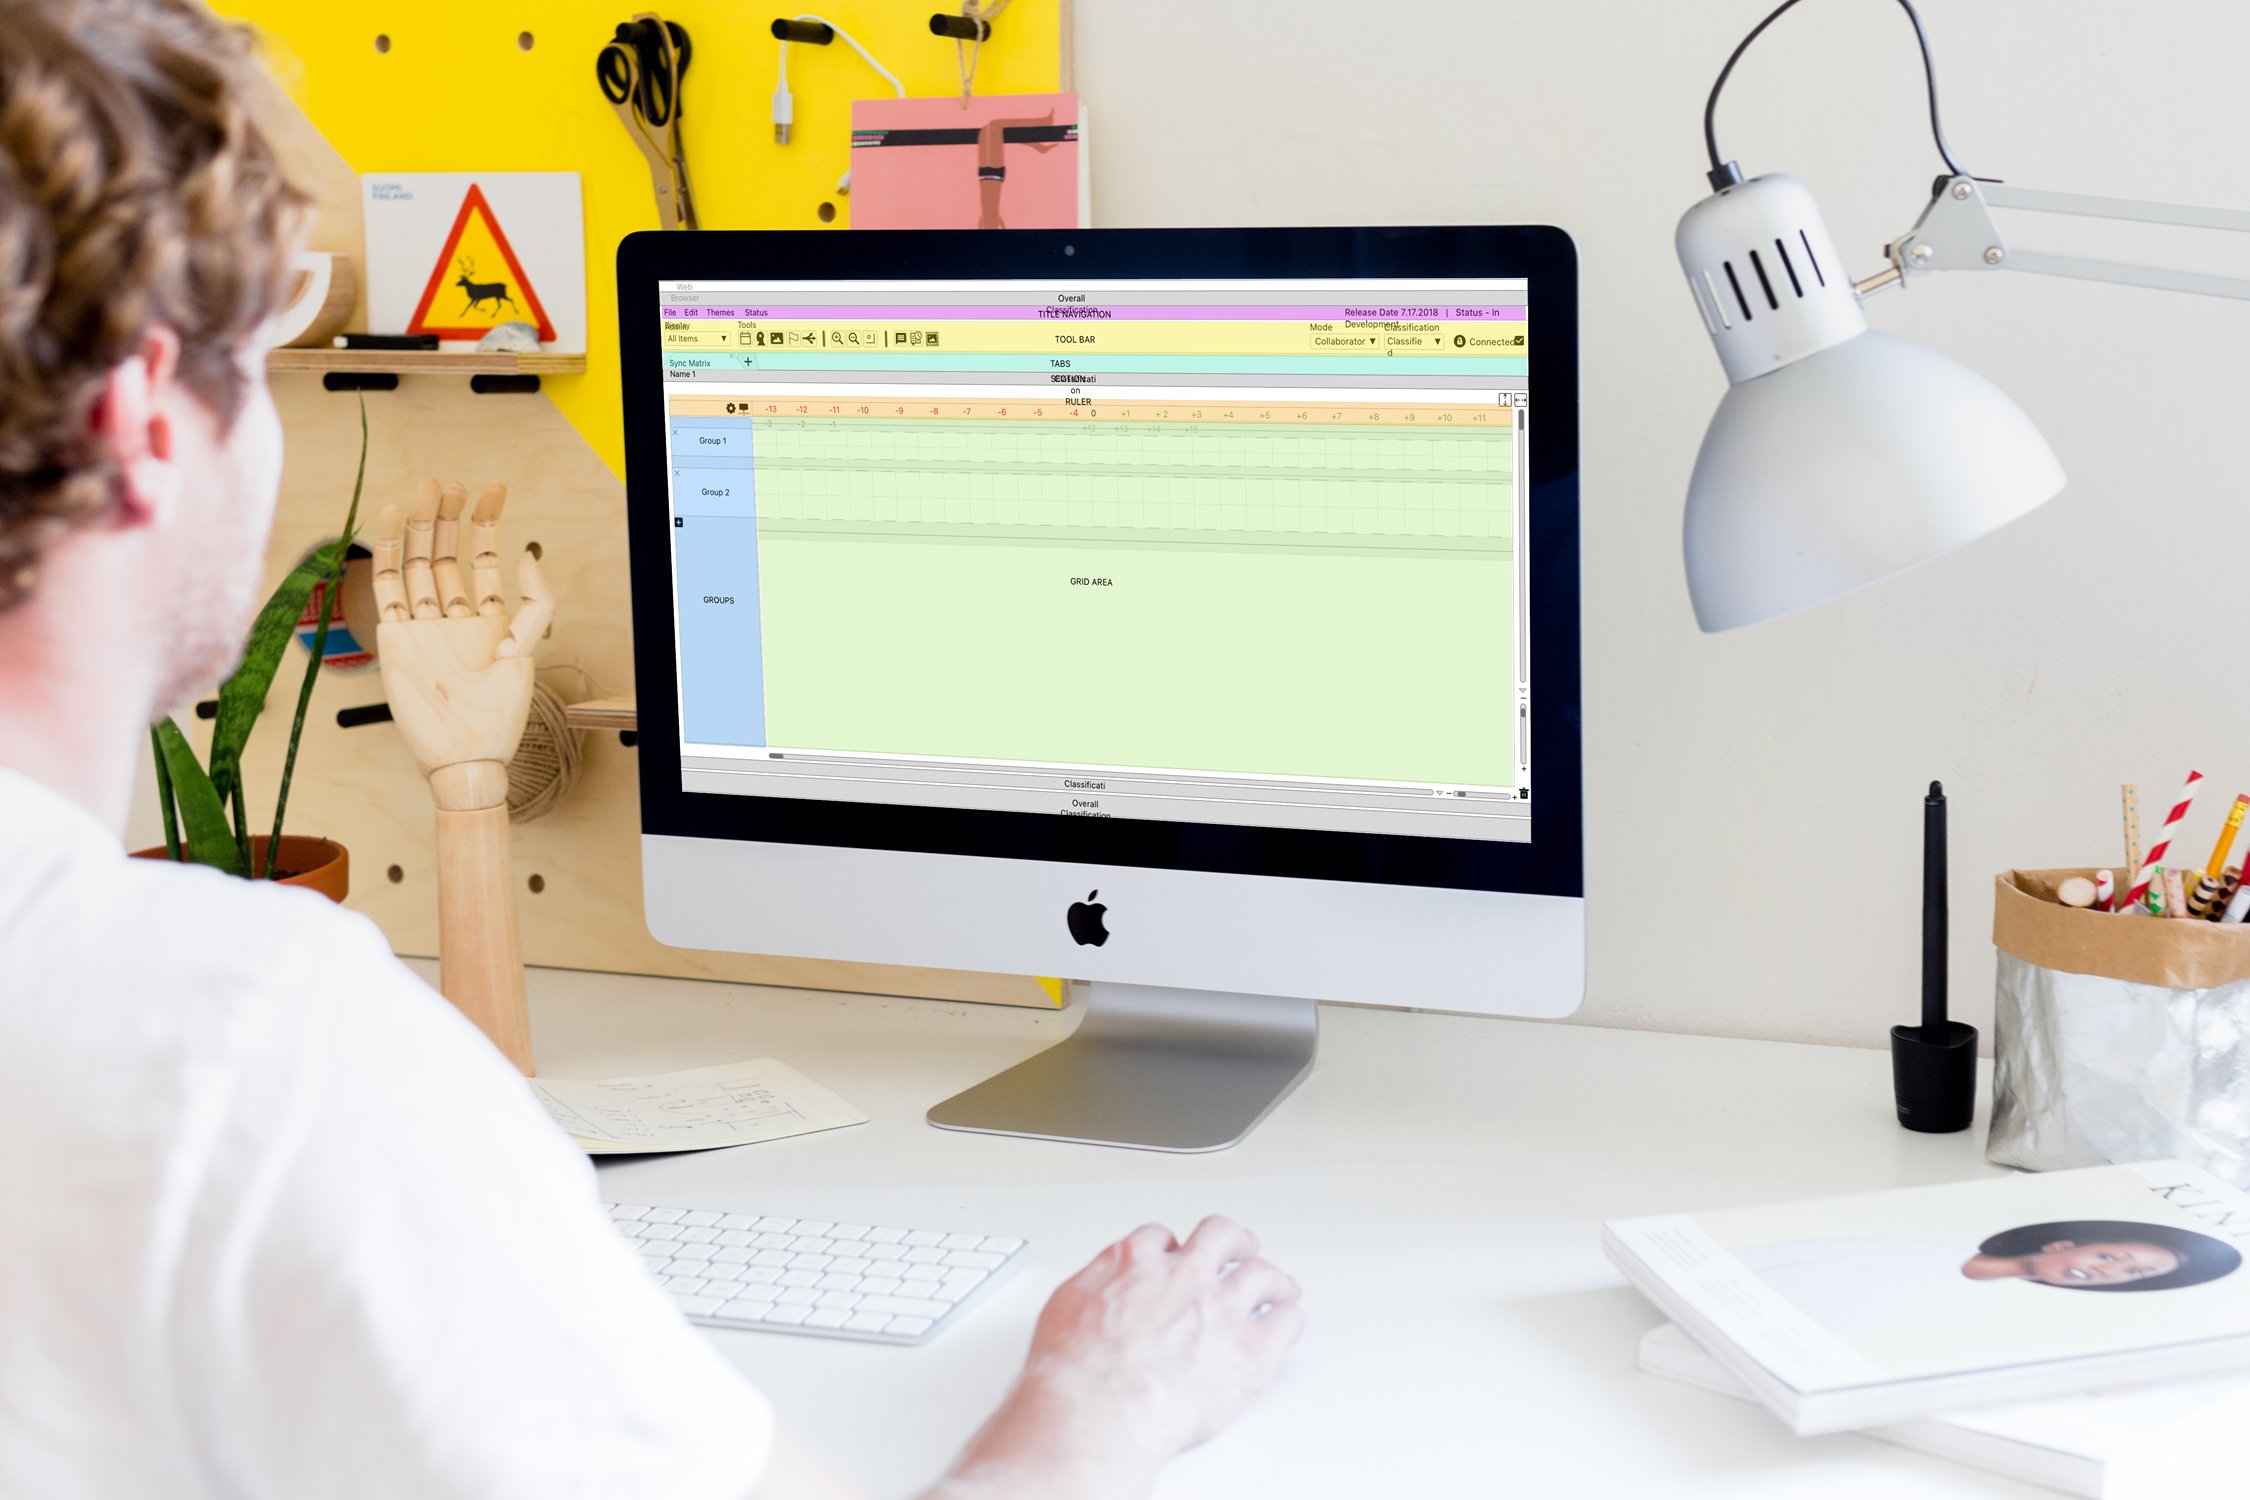
Sync Matrix - Box Diagram
Sync Matrix - Mock Up Design
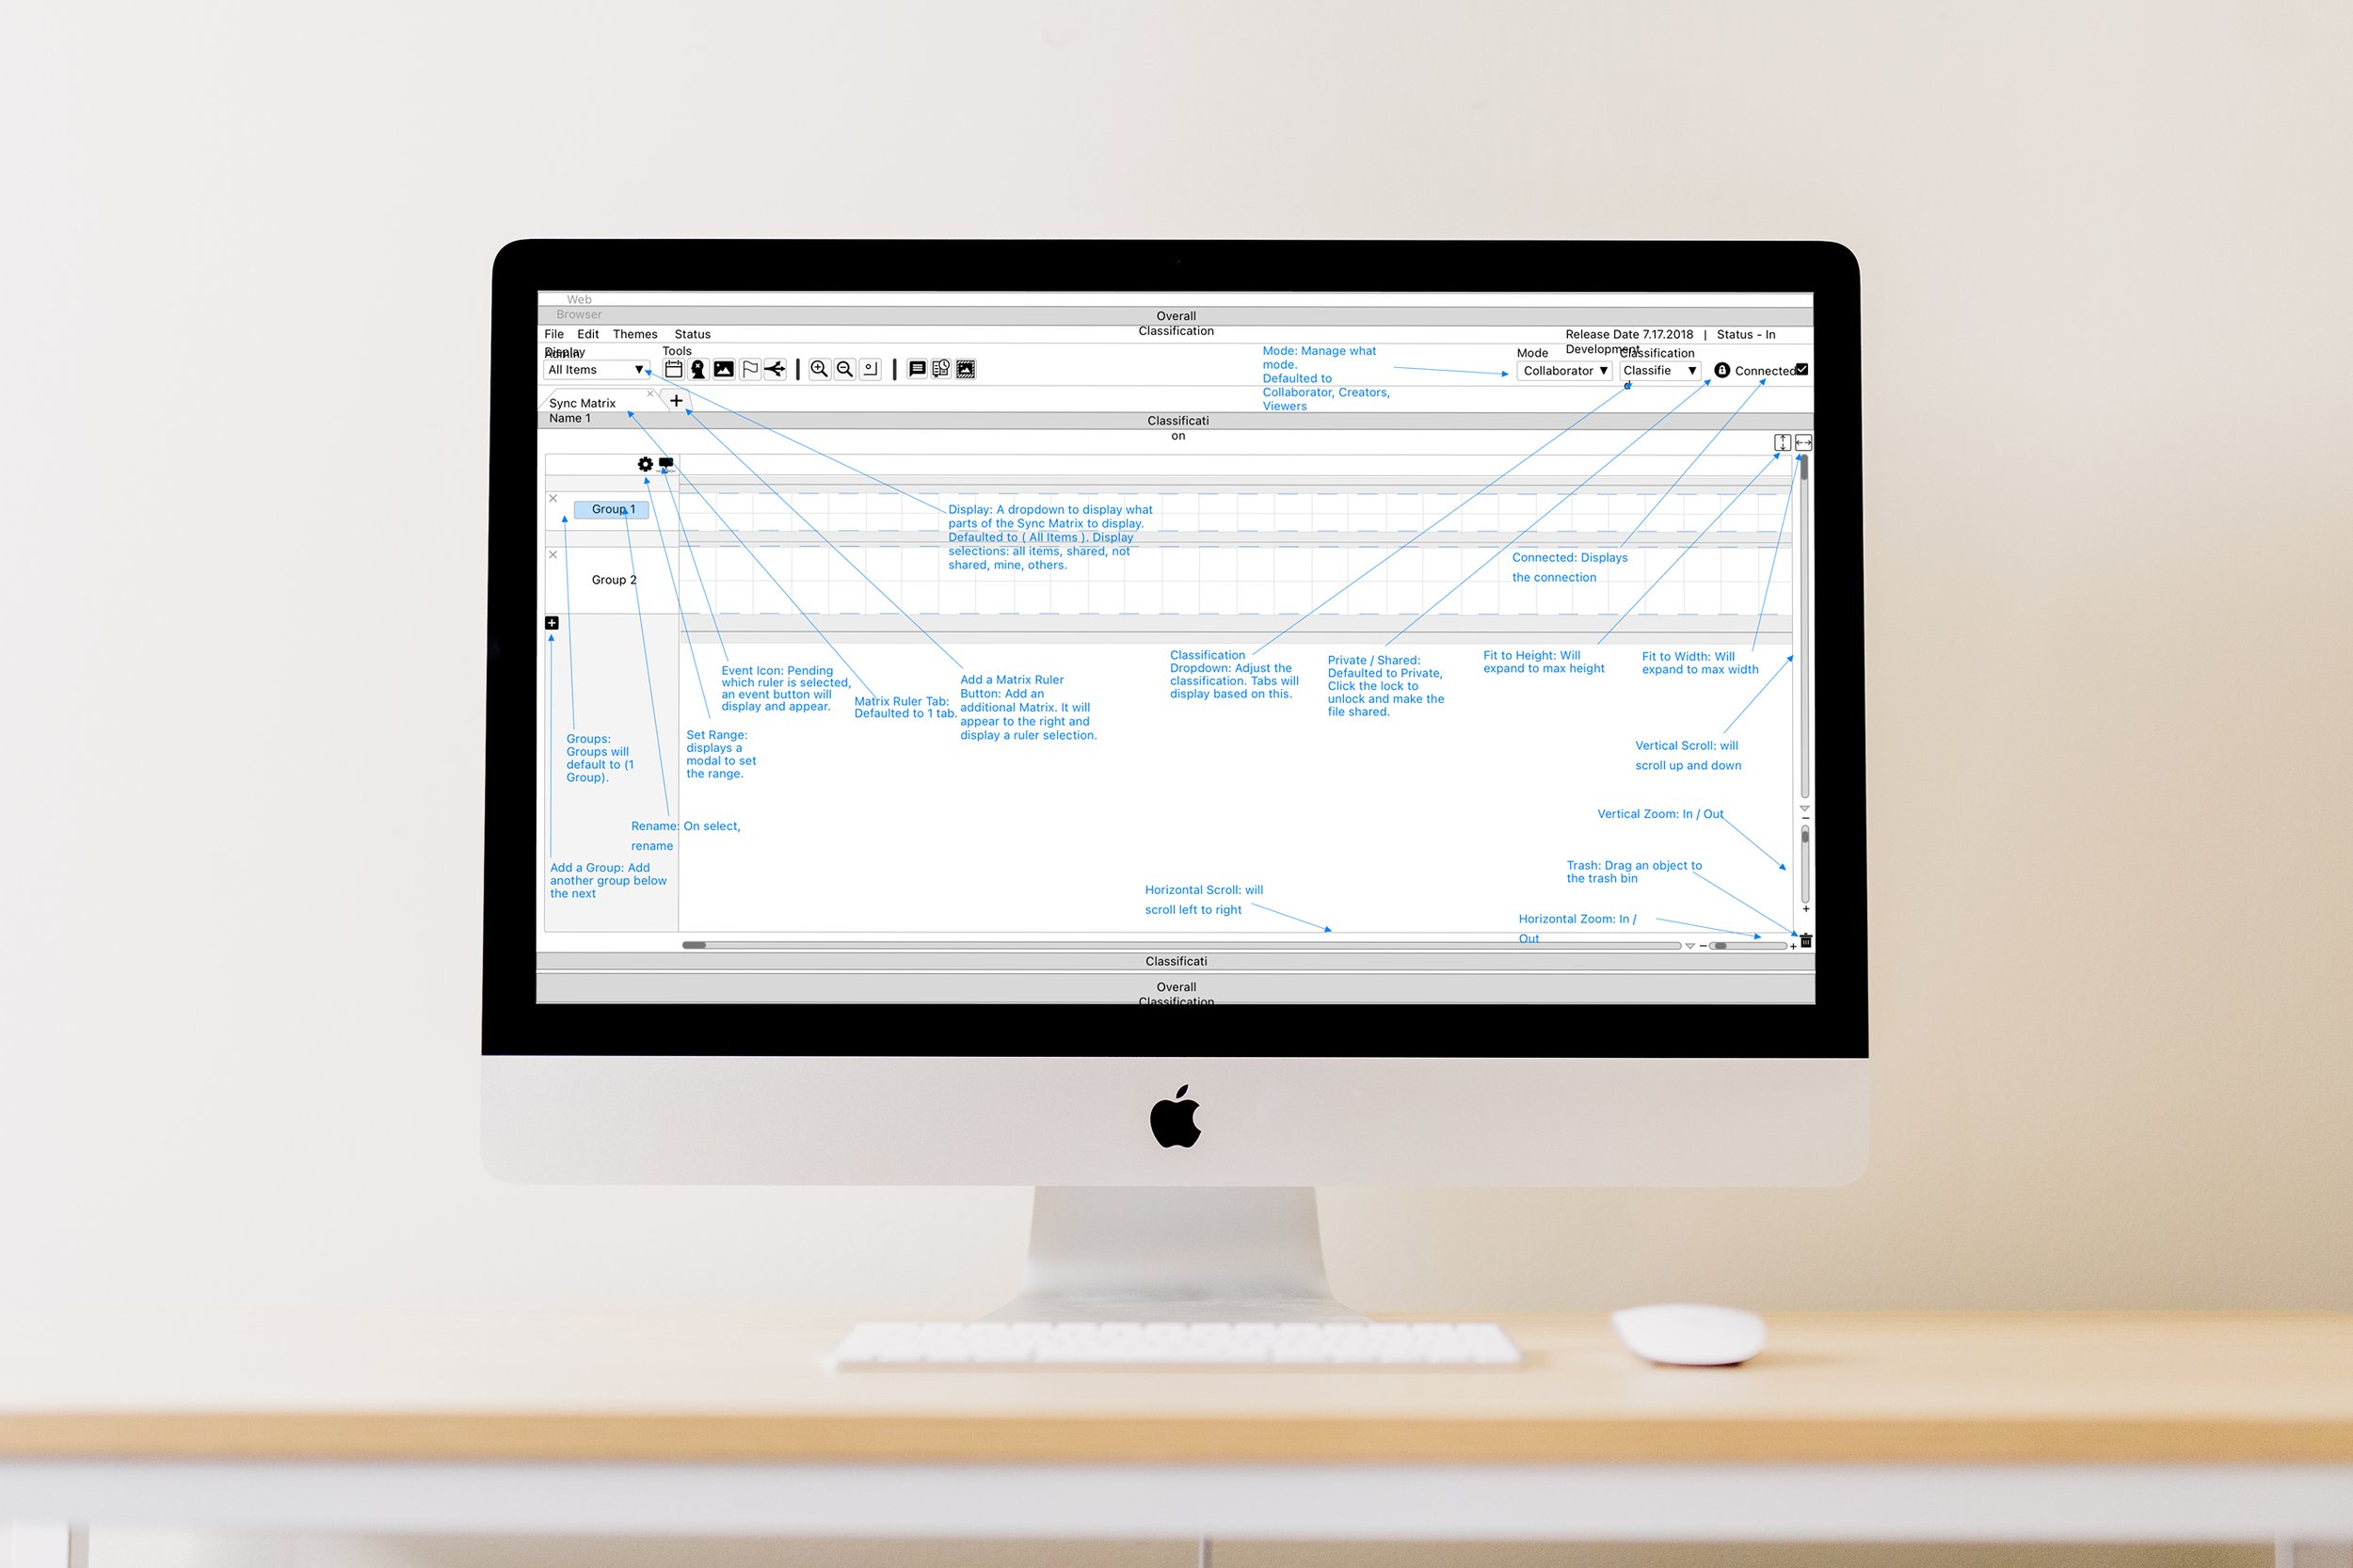
Tool Chart Annotations
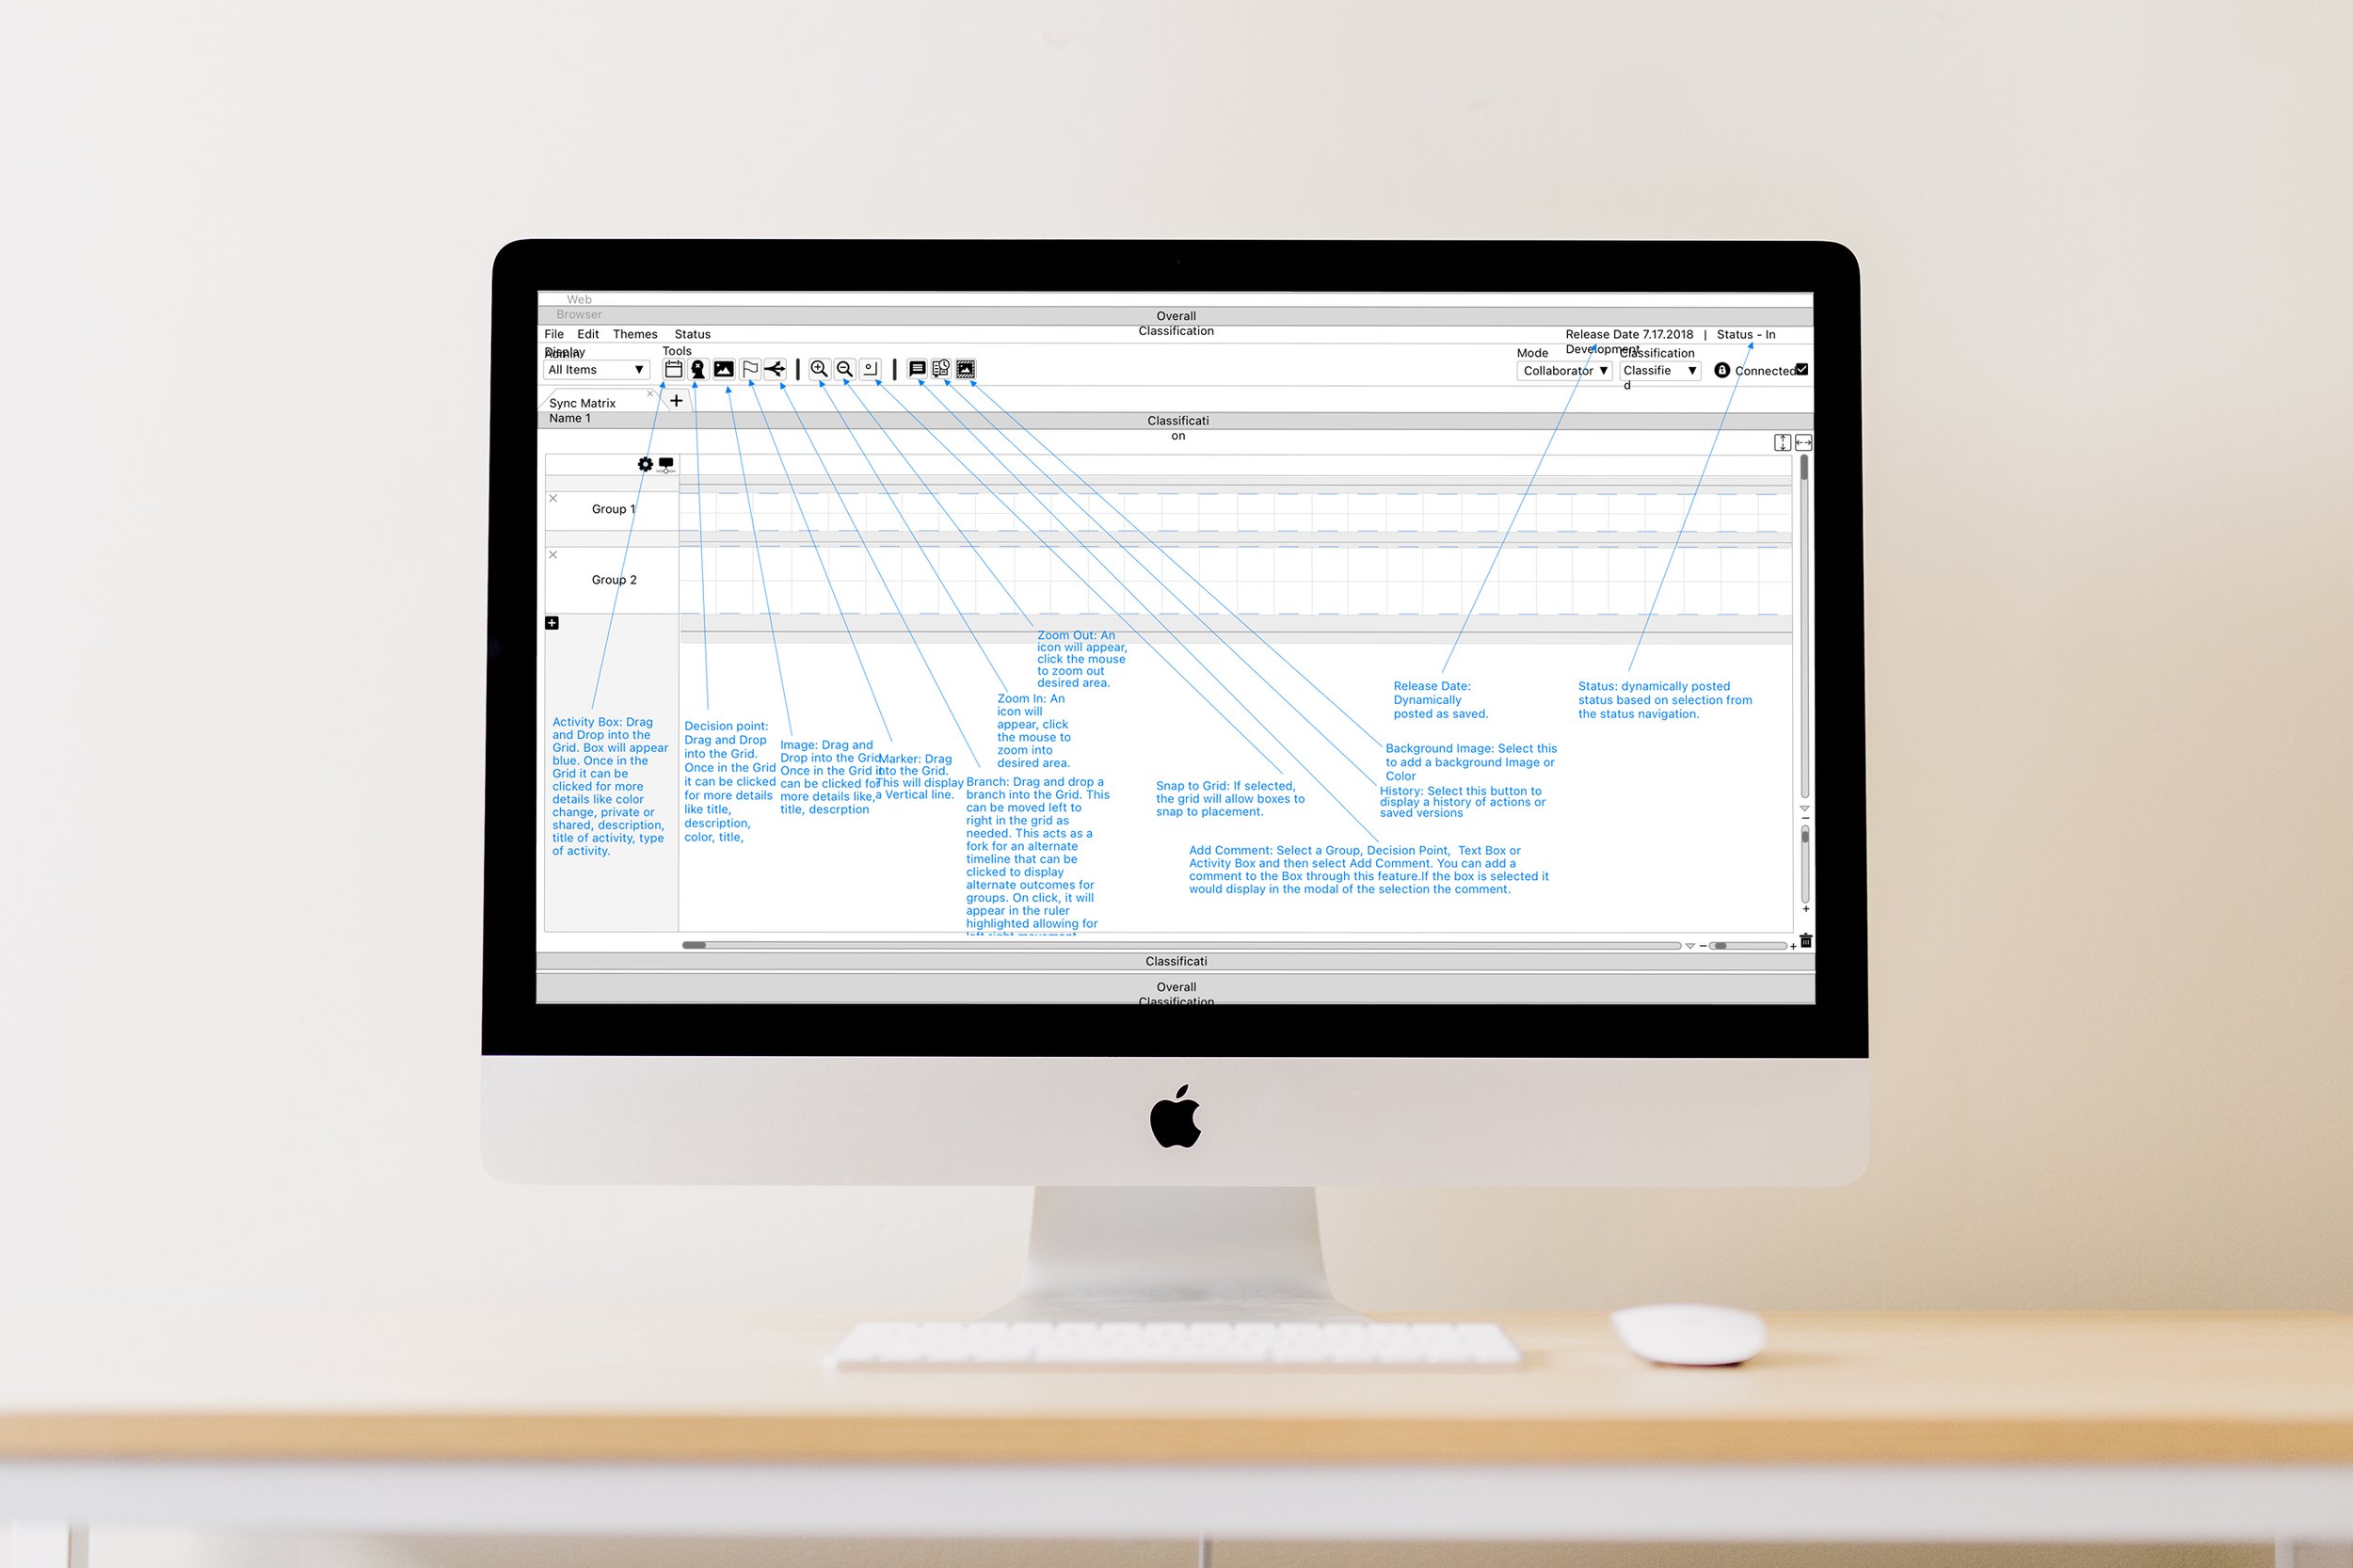
Tool Chart Annotations 2
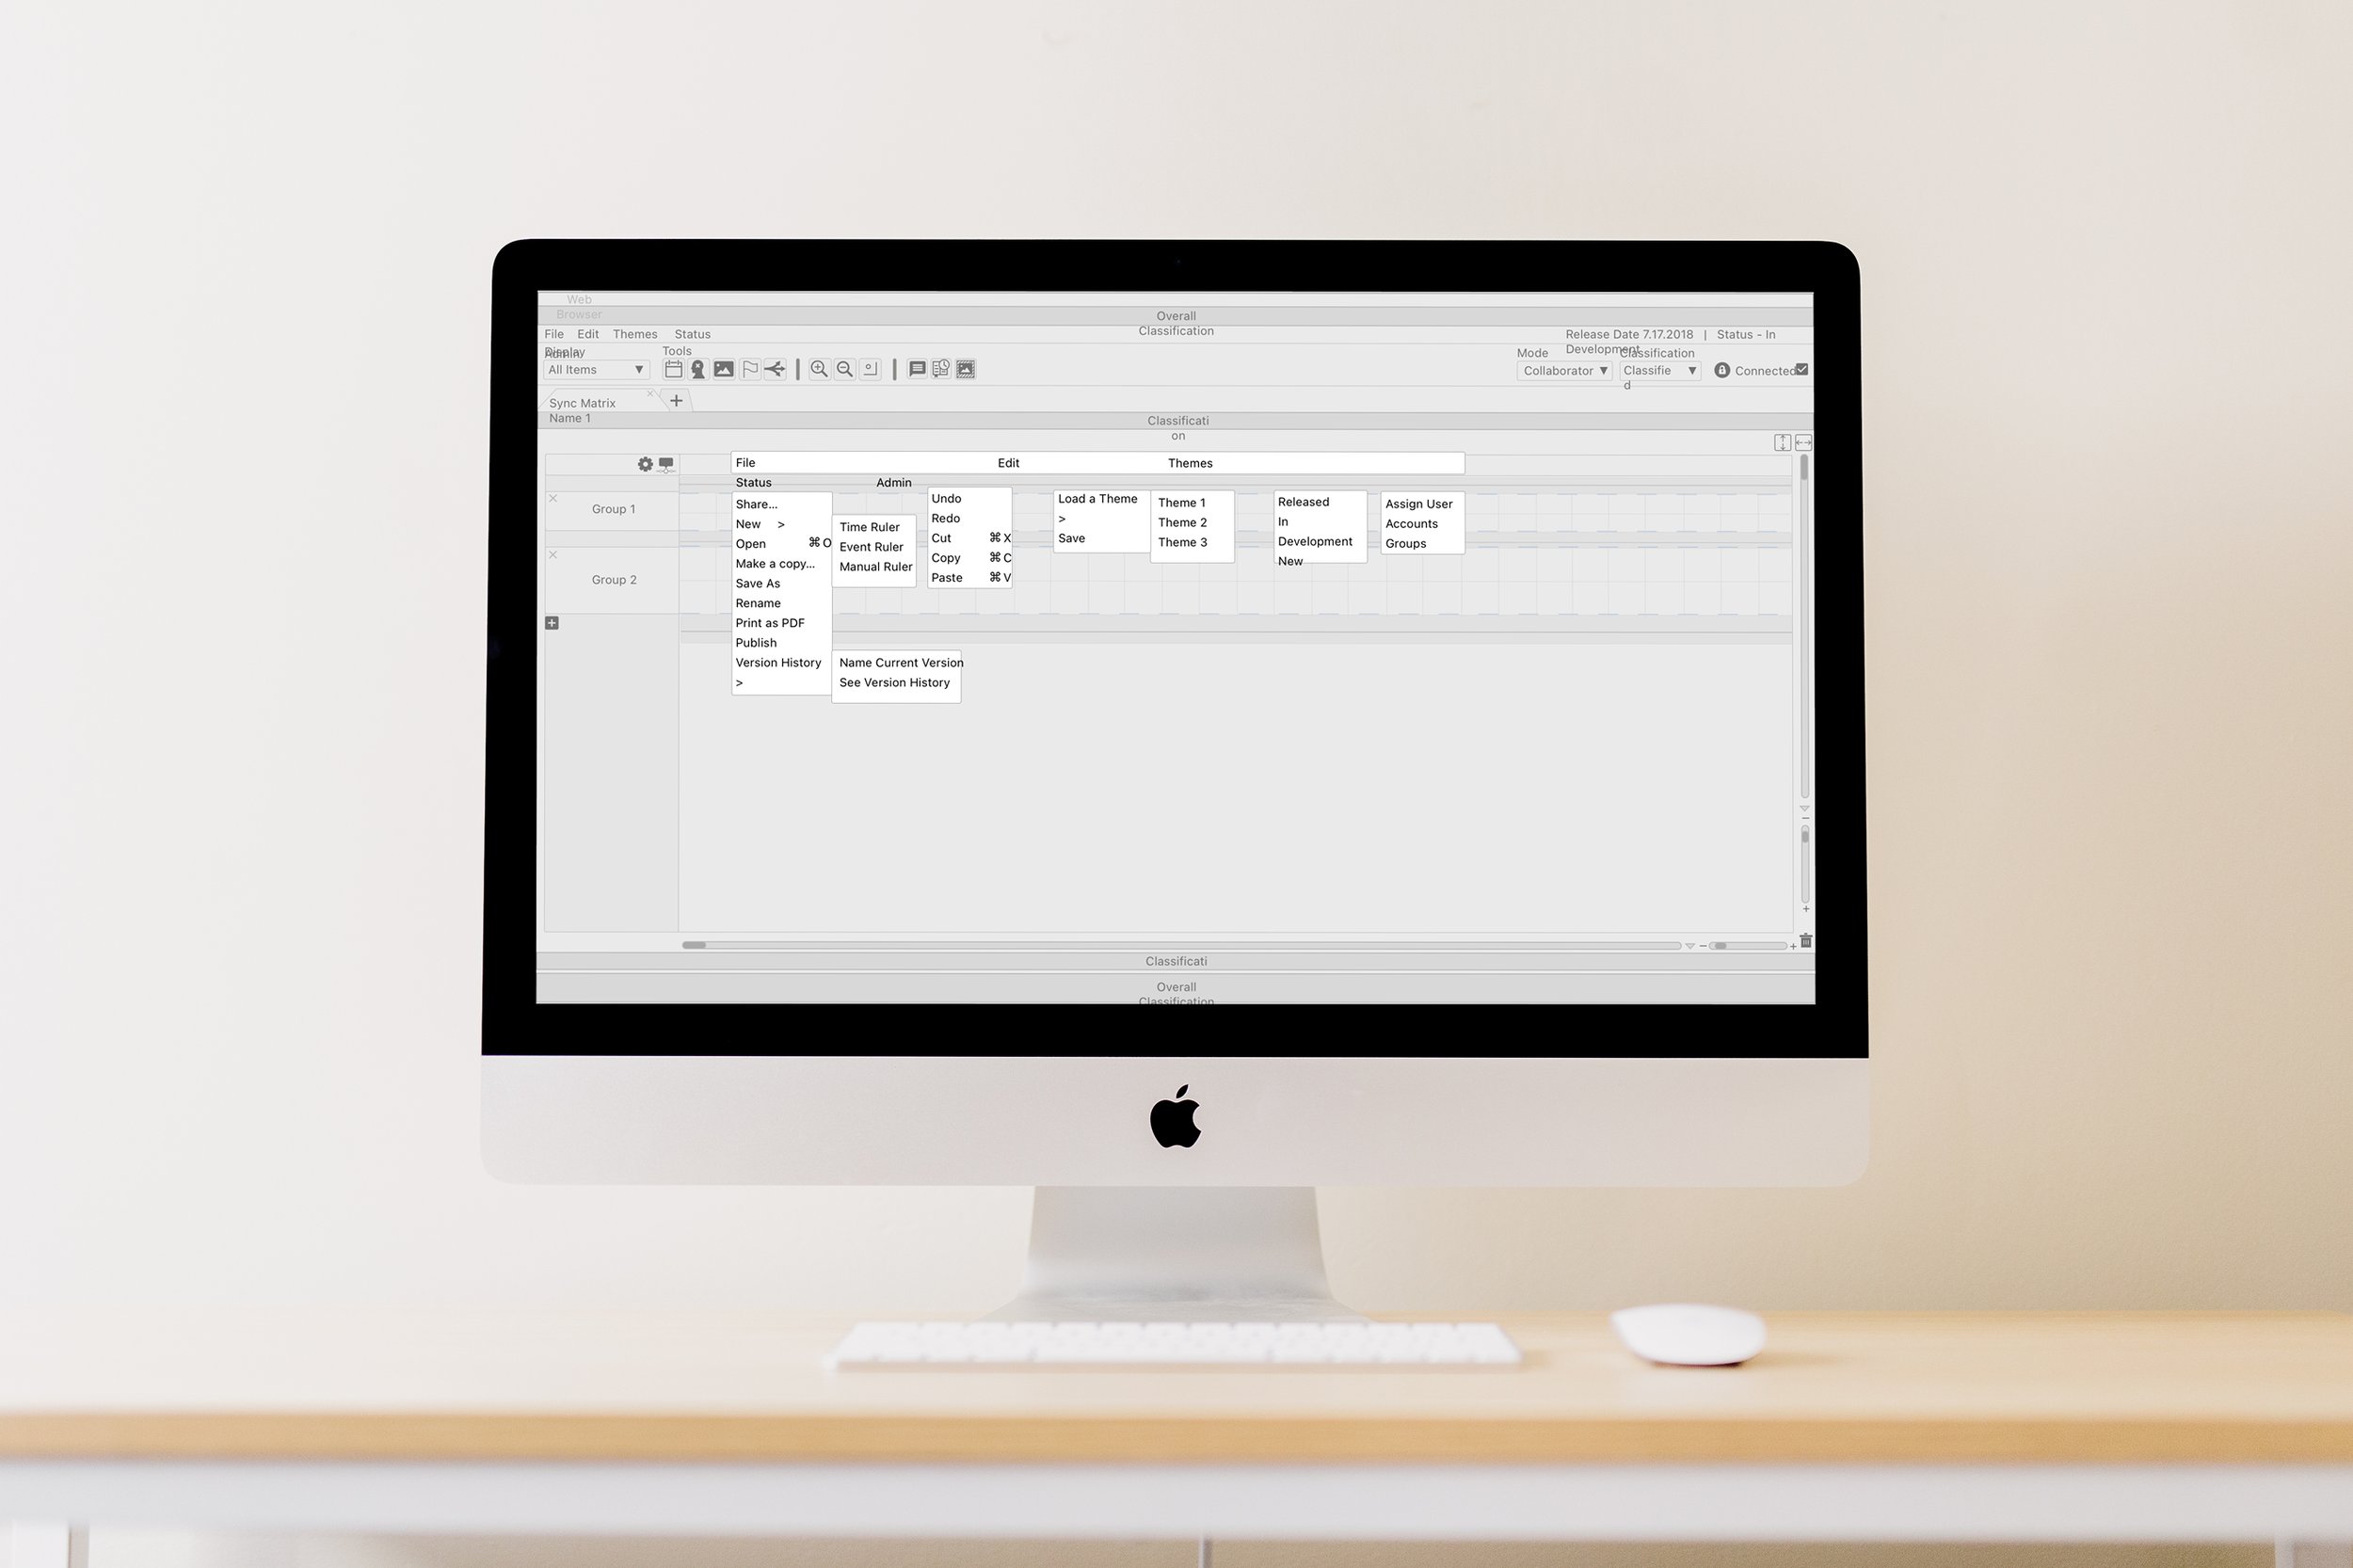
Top Navigation
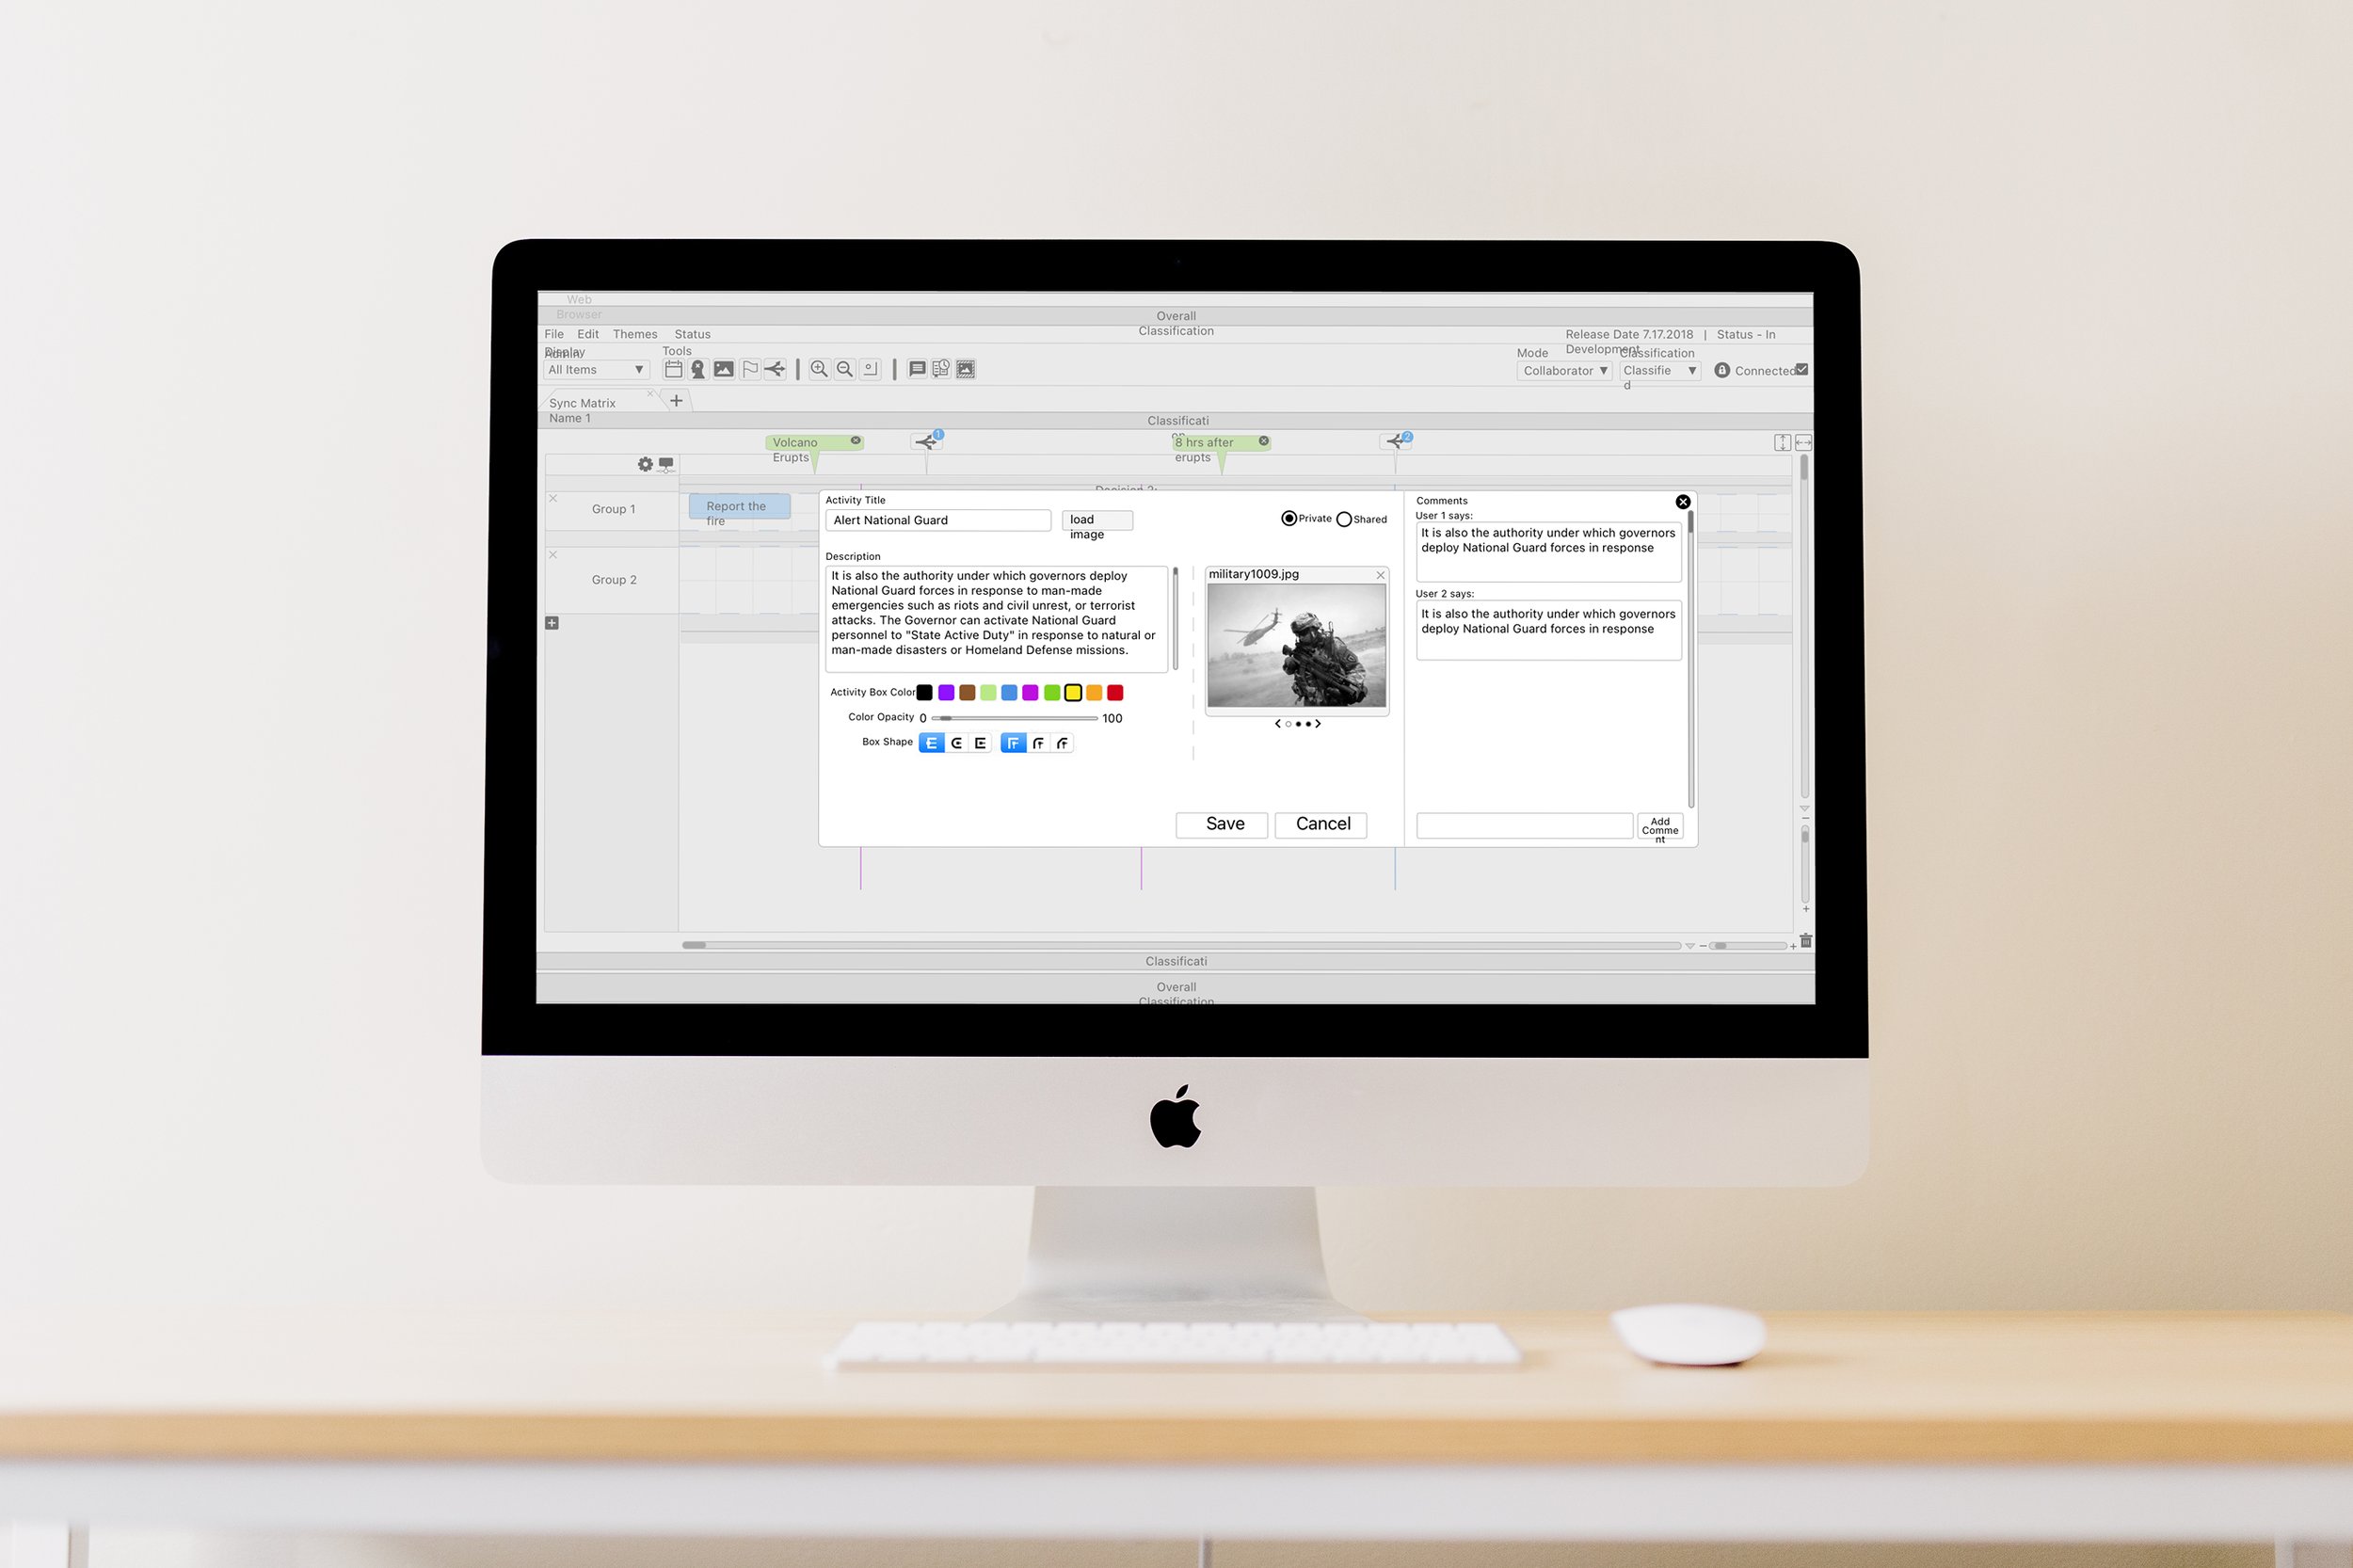
Pop Up - Add a Crisis
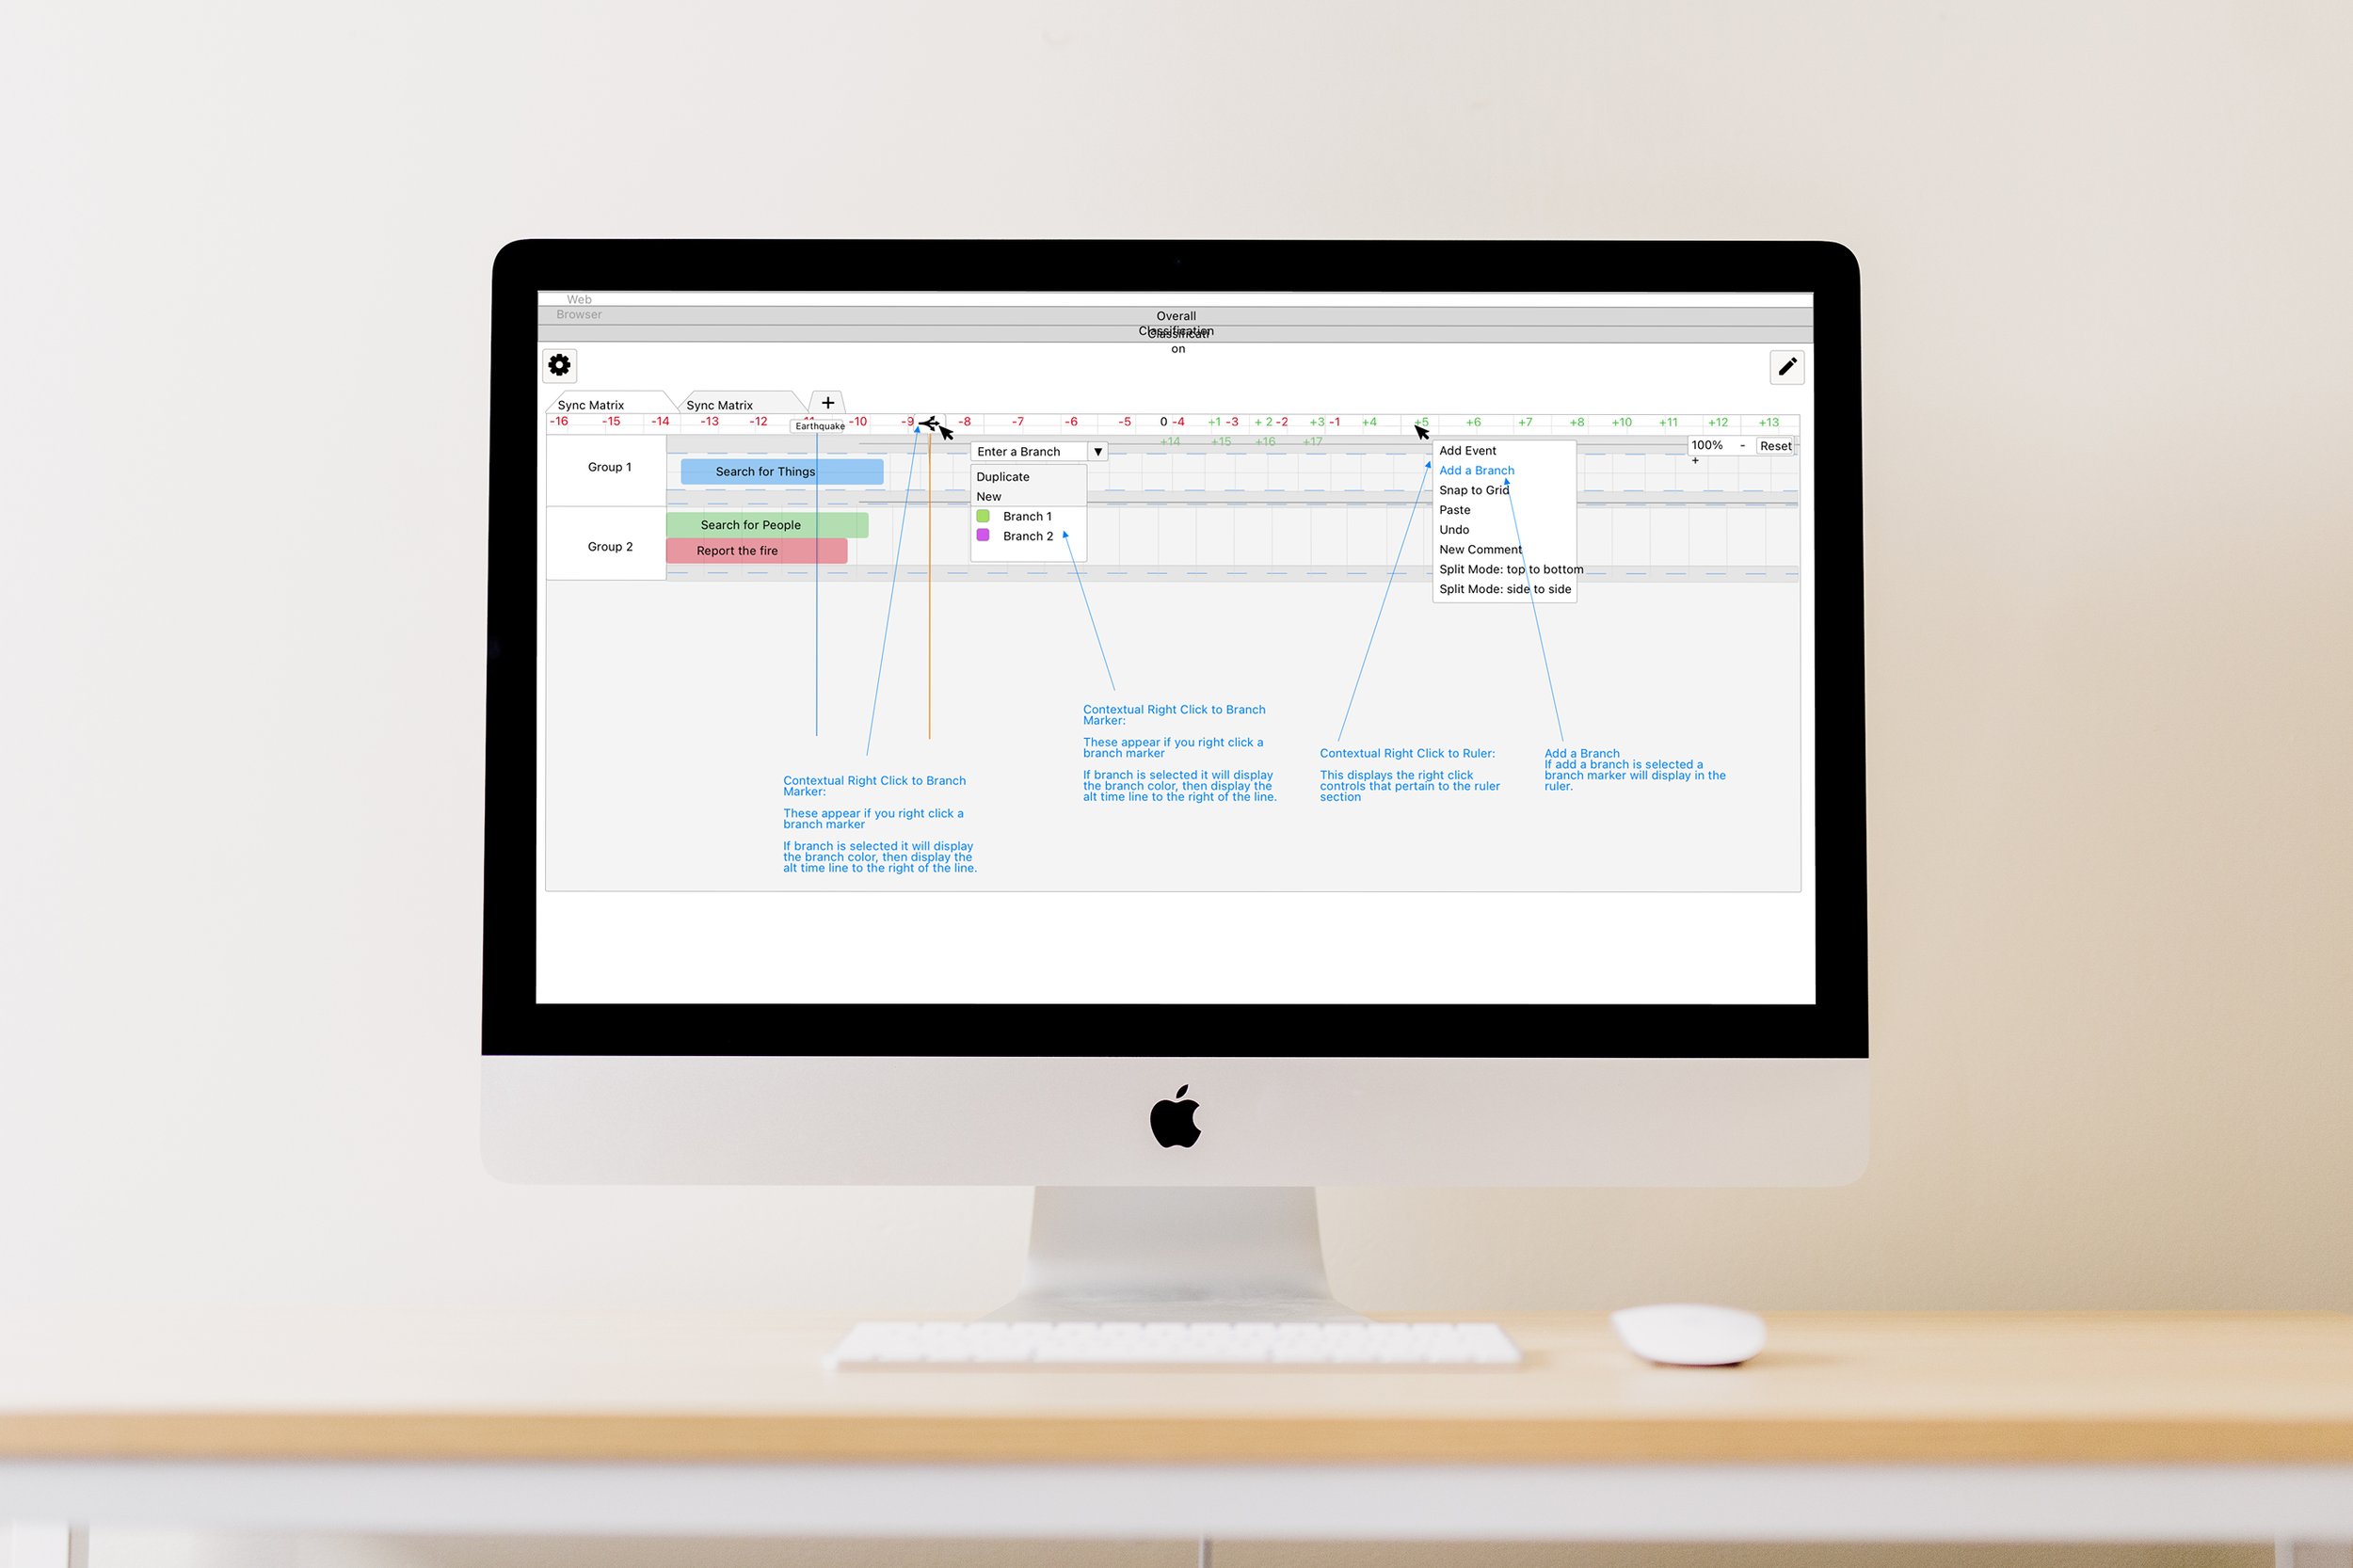
Adding A branch
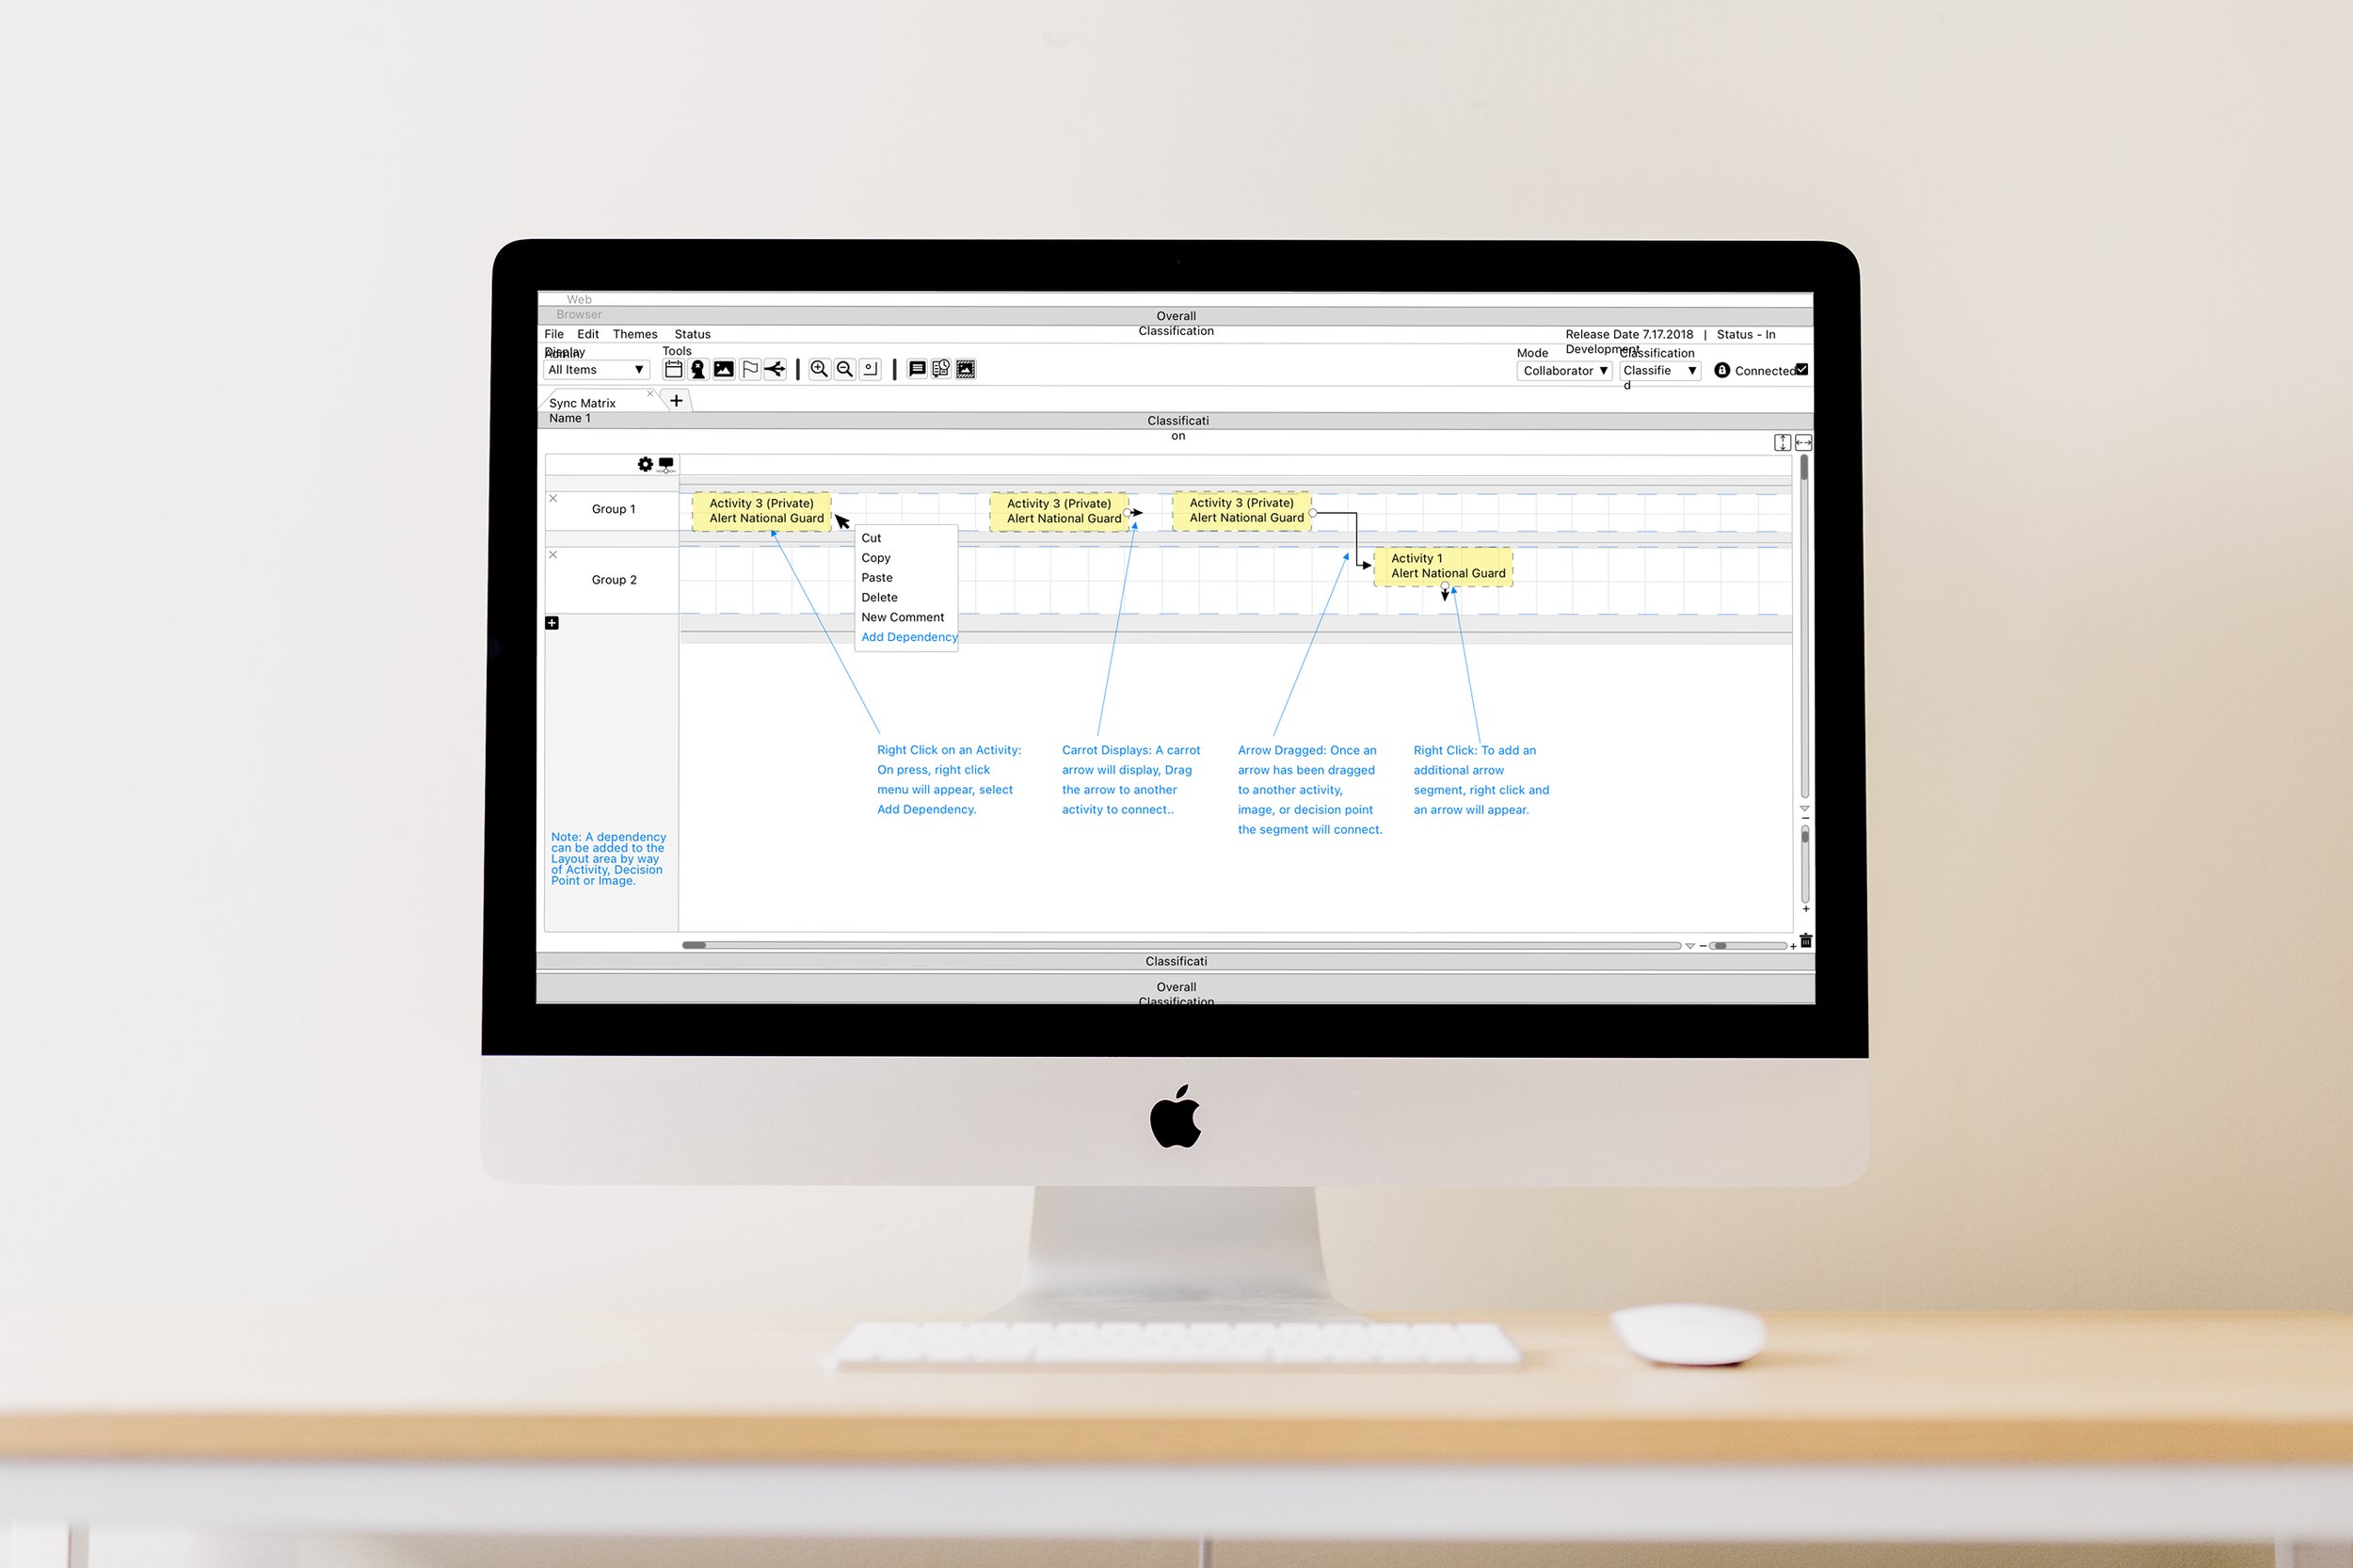
Adding a Dependancy
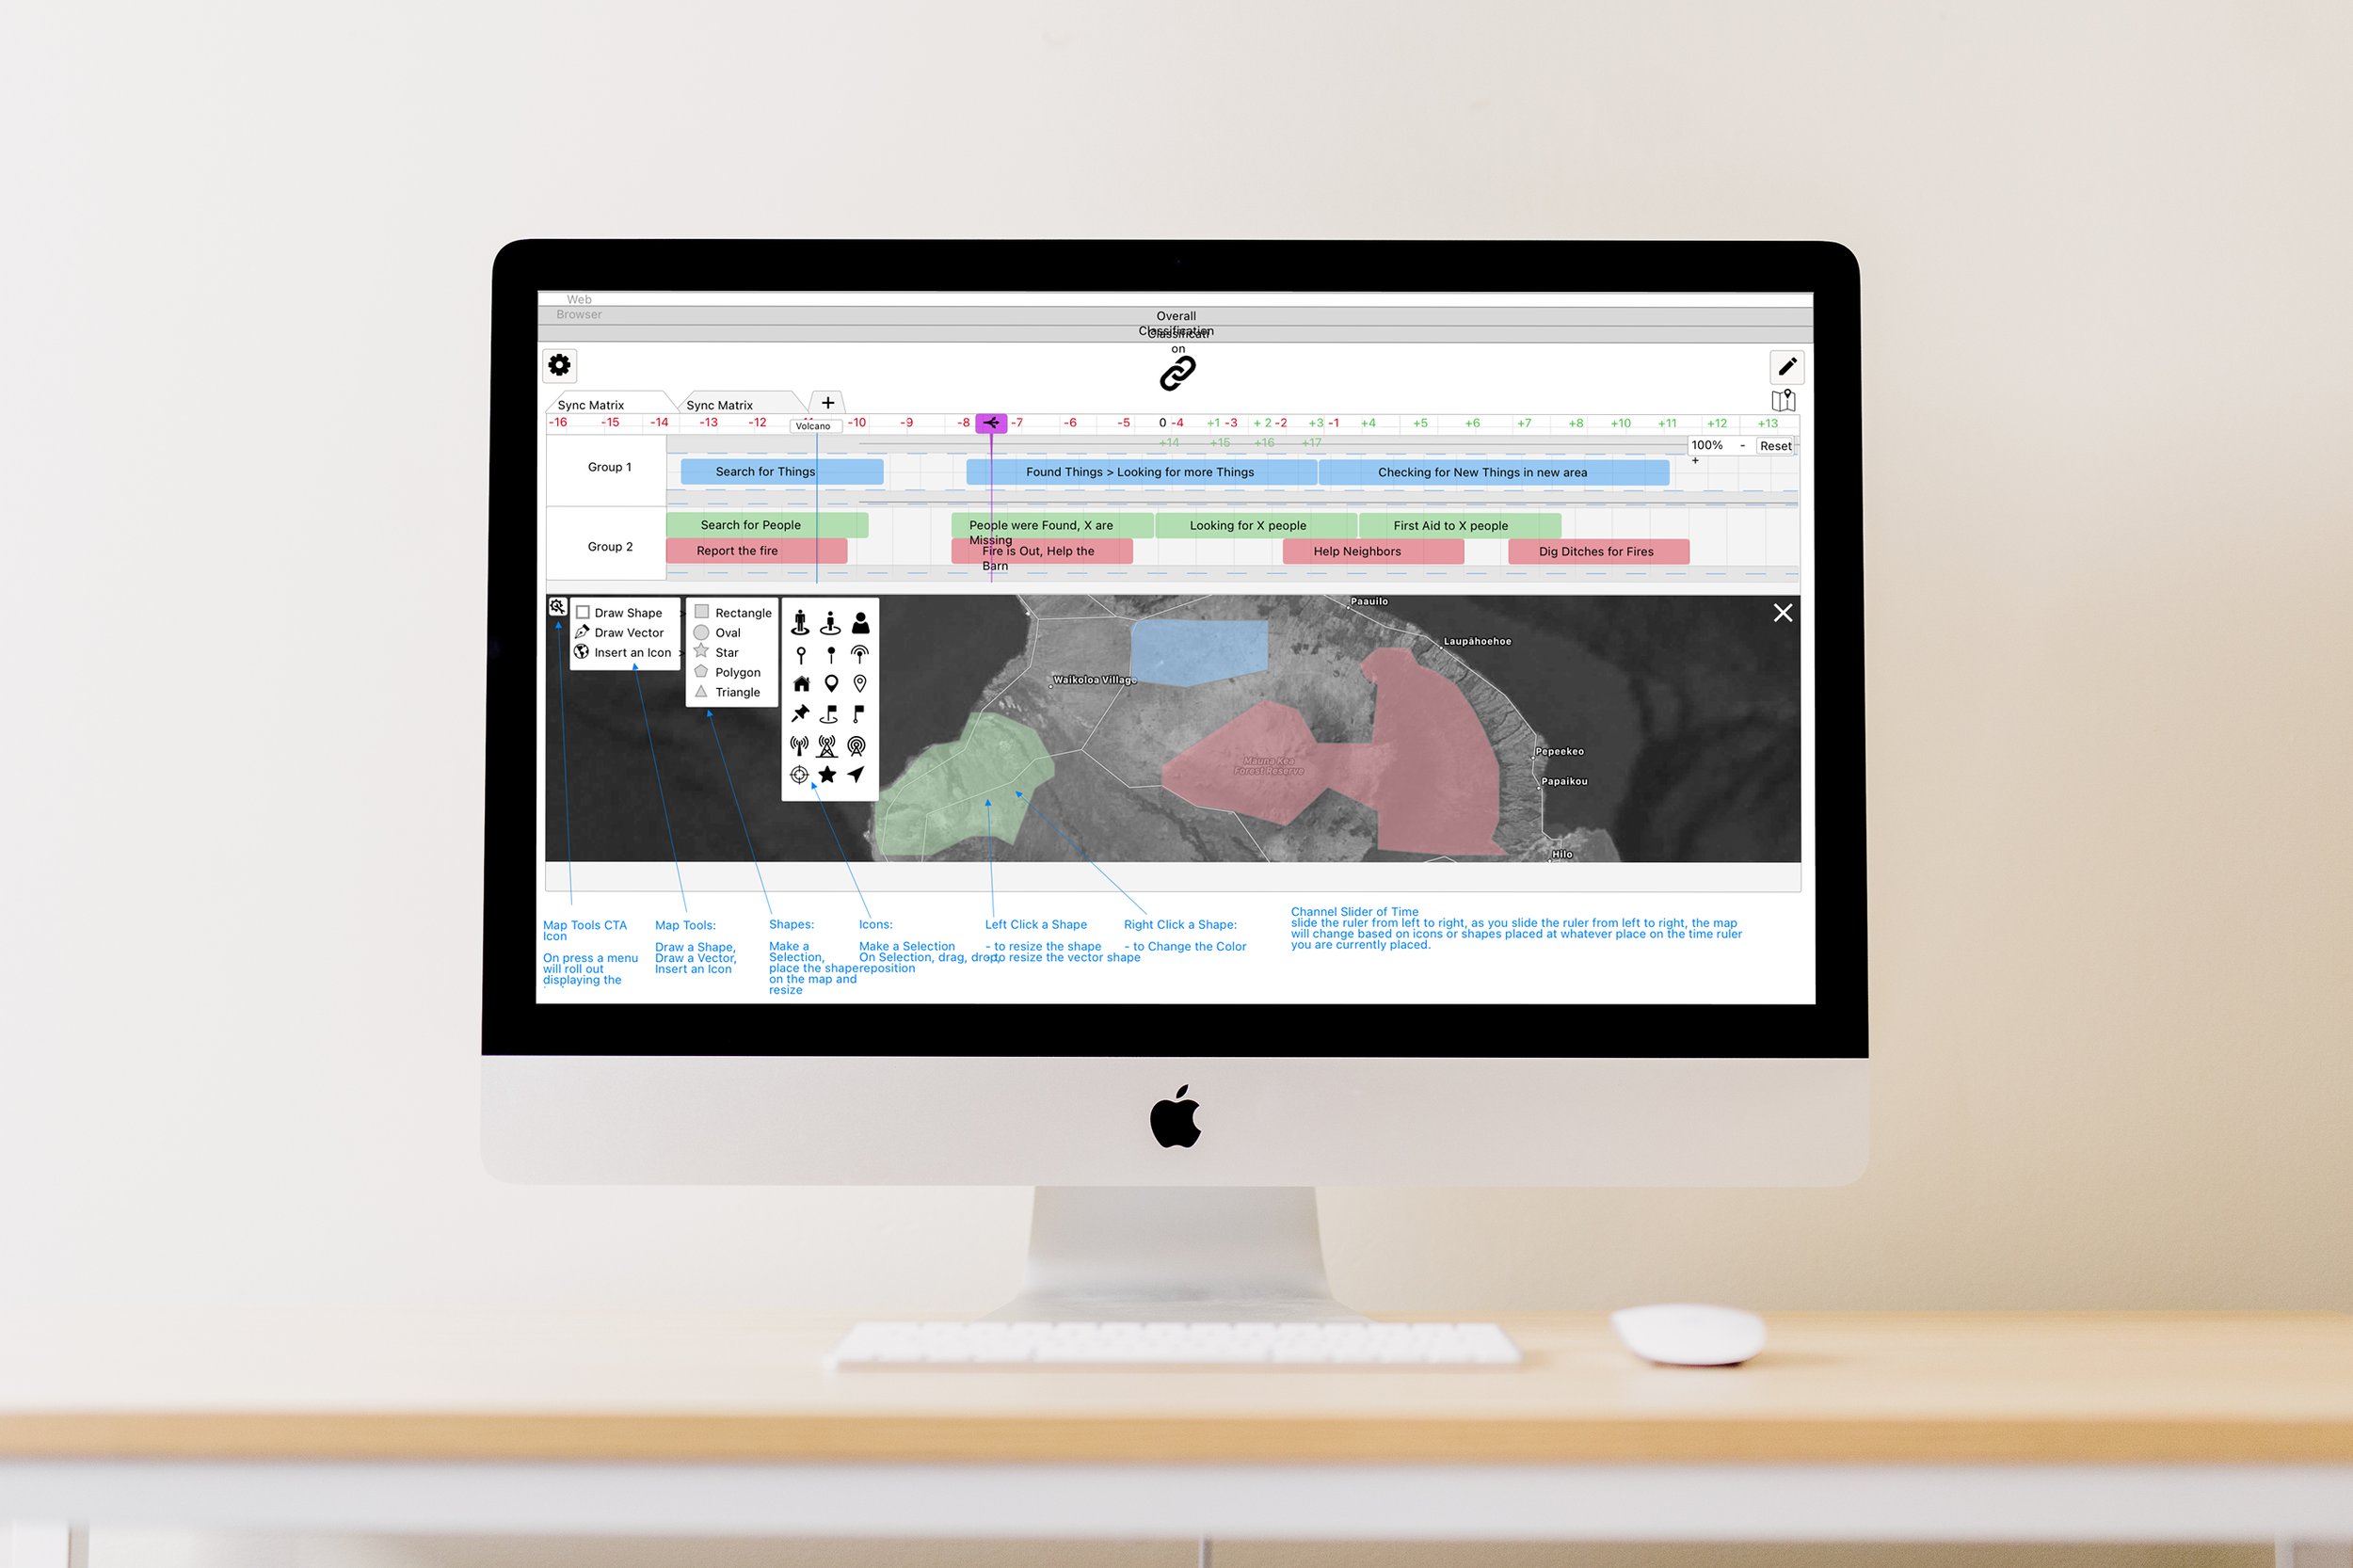
Split View with Map
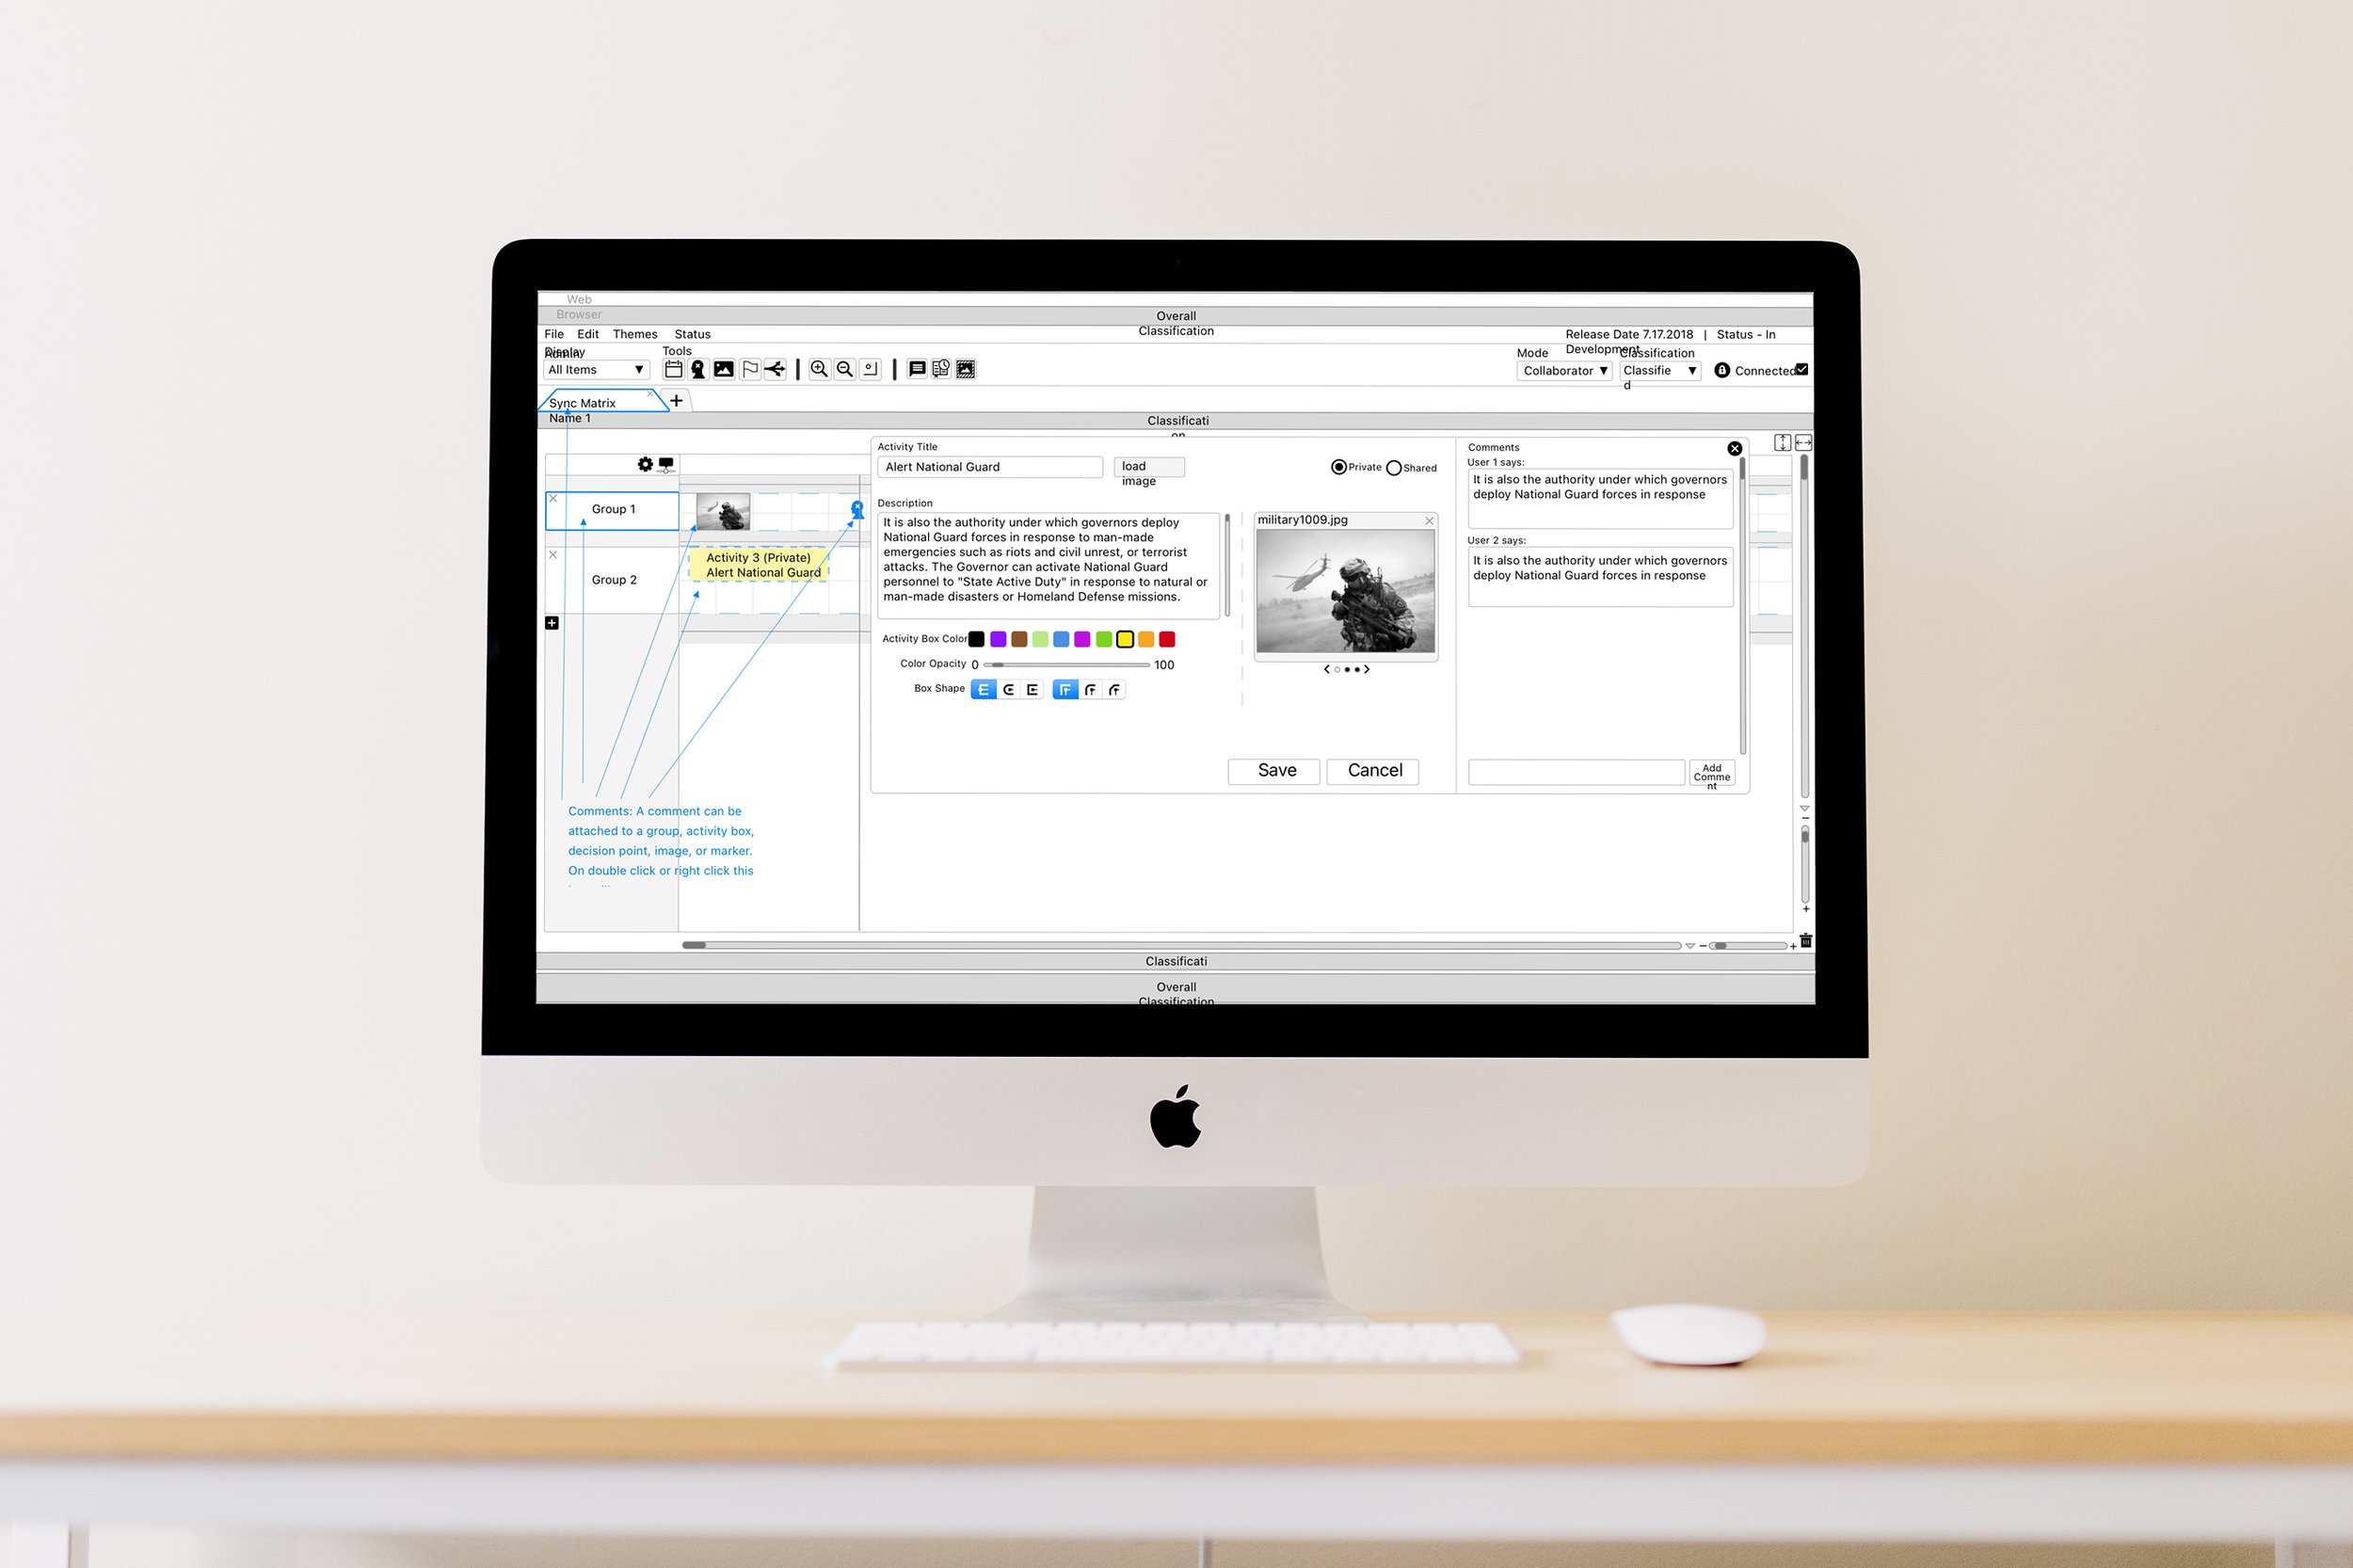
Adding a comment

Outcome: Zoic Labs partnered with Ball Aerospace on multiple contracts focused on ideation, discovery, and rapid prototyping. Our goal was to create experiential concepts that established early-stage intellectual property and demonstrated the value of improved user experience in mission-critical environments. As a result, the initial engagements were extended by an additional three years, based on the strength and strategic value of the prototypes delivered.